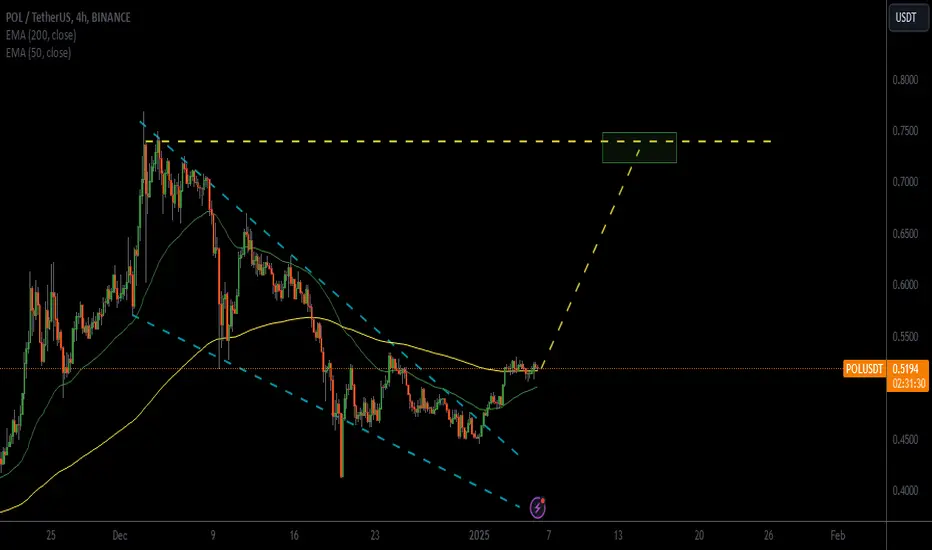
POL Analysis: Swing Continuation in PlayPOL's swing continuation remains intact as it touches its lower zone for the third time. This key level reinforces the structure, and we now aim for the next target at the upper zone.
Traders should watch for sustained momentum to confirm the move. However, caution is advised in case of unexpected market shifts.
Follow for more trade insights and updates.
NFA: This is not financial advice—always conduct your own research and manage risk effectively.
POLUSDT trade ideas

Pol bullish Key Observations:
1. Triangle Formation – The price range is narrowing, suggesting liquidity accumulation before a potential breakout.
2. Support and Resistance Levels – The lower trendline acts as support, while the upper trendline serves as resistance.
3. Stochastic Oscillator (at the bottom) – It's in the oversold zone (~10), which may indicate a possible price bounce.
4. Volume (at the bottom) – If volume increases before the breakout, the move will be more reliable.
Possible Scenarios:
Breakout Upwards: If the price breaks above ~0.2496 with strong volume, it could signal a bullish move.
Breakdown Downwards: If the price breaks below the support trendline, further downside may follow.

Pol bullish after 0.25Trade Plan
✅ Long entry above 0.25 USDT, with targets at 0.70 – 0.95 – 1.12 USDT.
❌ Stop-loss below 0.24 USDT, as a breakdown would invalidate the setup.

Polygon Ecosystem 4,300% Potential @10XHere we have several signals related to the candles low and close.
We've been looking at Polygon (POLUSDT) for a long while now and this is a great example of 'patience is key.' Definitely mandatory to have patience. It takes time for the bullish wave to unravel because we are always early, but once the action starts it cannot be stopped. We have the blessing of being able to be around right at the bottom, with plenty of time to plan, buy-up and accumulate. Many people won't be as lucky, they will hear/learn/know about the market only when it is too late or when the bullish wave is halfway.
The last candle closed as a hammer with the highest volume ever. The session low is a higher low compared to the 3-Feb session. A hammer is a reversal signal when it comes at the end of a trend. The high buy-volume confirms the hammer as a bullish reversal signal. Normally, 1-2 weeks are needed for confirmation but we know that will happen next. I don't wait.
The close this week (last week) ended up being higher than the late October 2024 market low. This is another important signal. Twice POLUSDT wicked lower in February, but closed above this level. This level is marked with a purple line on the chart.
As a friendly tip. We are active with high leverage on this pair.
The chart is ready, the market is ready and timing is great.
430% potential with 10X can lead to 4,300%. This is possible and do-able. There will be more of course. Opportunities abound in this market. Crypto is going up. Buy and hold.
Thank you for reading.
Namaste.

POL is bearish #POL or the former #MATIC has a clear pattern of bearish structure i think that the triangle can force the market to go down again !

Polygon signal First tip 0.43$ 💯%
Second tip 0.71$ 💯 %
Third tip 1.2$ (depends on polygon news and polygon community)
Last tip 2.1$ (depends on polygon news and polygon community )
All details on the chart 📈📉

Watch closely Expect a movement at any time On the chart you can see the previous
movement how happened
All the points are shown on the chart
I expect a trend on matic that can lead us to see
1$ if we break the of 0.44$
Under 0.44$ the price will swing between 0.28$
to 0.43$ but if we break the resistant of 0.44$
and i do expect it, the target going to be 1$

Desc channelsUpdated Polygon TA. The price has been in a descending channel since Dec. 2nd but looking to try to break out soon (orange lines). I don't see it breaking down out of that channel which would put the price around 10 cents. It's already very undervalued so breaking down further doesn't seem likely. If it does, I'll buy a more! Once it breaks up I'll be looking for it to retest the larger blue descending channel. If it breaks above that upper trend line of the larger channel I think we'll really be off to the races and will probably rise above last year's high of $1.29. I fully expect that to happen it's just a matter of when. I think we'll have $3 to $5 Pol by the end of this year. 👊

Polygon Ecosystem Token Update (500% Potential) —Time To TradeGood afternoon my dear friend, fellow genius male traders and beautiful female winners, how are you doing in this wonderful day?
It is already confirmed.
We are live and we are trading.
We are active on POLUSDT with leverage, high lev.
There has been no new lows since the 3rd of February and the market is moving up.
All the waiting is coming to an end.
We are about to grow/blow up.
311% is an easy target, that's my belief based on the chart, the 2025 bull-market cycle and early marketwide action. This pair will produce strong winners. Remember the comparison between this one and ADA on a previous post.
I did the 2025 All-Time High numbers for all the Altcoins, hundreds of those in late 2024. You can visit my profile and use the "Search filter" to find them. Just type in your preferred pair and you will find thousands of charts with full numbers and thousands of pairs.
POLUSDT is still early. Early means great.
Once we get in at bottom prices the rest is very easy. We simply wait.
Why is it important to buy-in when prices are low?
Because there will be swings and shakeouts, there will be surprise moves and flash-crashes. With a great entry, we can remain calm and collected when the market starts to grow.
If we enter the market with a developing wave, we tend to freakout when the market shakes. We join the group known as "weak-hands." That's not possible, we are strong. We have strong hands, diamond hands and an eternal soul.
We are winning now and will continue to win long-term.
Patience is key.
Persistence and consistence is necessary for success.
This is only the start.
We are looking at bottom prices.
From the ground (bottom) up-we grow.
This is a friendly reminder to let you know that soon Polygon is going up.
Thanks a lot for your continued support.
Are you ready for the Altcoins?
Namaste.

POLUSDT Rising PotencialThia piece of dog vommit may rise to it's last high after getting out of a rising wedge pattern
Forever Crash? The Truth About Polygon's Ecosystem Token (POL) Remember Cardano last year?
Remember how Cardano became weak during the second part of 2024 and continued to be weak for so long? How did it all end? It ended with a very strong bullish wave.
After the bearish phase, Cardano ended up being one of the strongest moving pairs.
The same can happen in this upcoming cycle with POLUSDT.
The following is also true for Notcoin (NOT).
The lower it goes, the stronger it grows when the time is right.
This pair right now is bleeding massively but this shouldn't be a cause for concern. The market moves in cycles and within these cycles we have waves.
A bearish wave is followed by a bullish wave.
A bullish wave is followed by a bearish wave.
The positive side of a bearish phase is the fact that you can't have a forever down-wave. If it is bearish now, it will turn bullish next.
The last peak was hit in early December 2024, more than two months ago.
A Cryptocurrency trading pair, within a bull-market year, can go bearish for 2-3 months, not more. This means that POLUSDT is getting very close to producing a reversal, very close to a change of trend.
The market has been going down. We saw some bullish action but this action wasn't a bullish trend. It was simply a "bounce" within the broader decline, here starting March 2024.
The great news is that the next rise won't be a bump, it will be an uptrend and an uptrend produces higher highs and higher lows. We are set to experience long-term growth.
Right now it might be hard, but patience is key.
The market can be red, shy and weak now, but everything will change within weeks.
Believe it or not, the time to buy is now.
We are in the accumulation phase.
When the first move starts, it will be too late for low prices; there will be opportunities to enter and to enjoy massive growth. But only those with a vision can buy and accumulate when prices are low.
It will be a life changing bull-market.
It will be the biggest bull-market in the history of the Altcoins.
Bitcoin will be really strong but standard.
The Altcoins will blow-UP.
Namaste.

POL/USDT: Ready to Rocket Past Resistance?POL/USDT is currently consolidating within the daily FVG after pulling back from its peak. Since early December, the price has remained below the descending trendline, acting as resistance. A breakout above this trendline could trigger bullish momentum, presenting a strong entry opportunity. Key targets are highlighted on the chart.

TradeWithMky on POL chart🔥 MATIC Analysis 🔥
MATIC is holding strong at a key support zone, perfectly aligned with the 38-61% Fibonacci retracement. The reversal pinbar 🕯️ is flashing a potential bounce signal 📈. Eyes on the charts 👀—a move toward the resistance zone might be in the works! 🚀
Trader: TradeWithMky
Hashtag: #tradewithmky 💡
@TradeWithMky

POL - Bullish Pressure Soon!Hello TradingView Family / Fellow Traders. This is Richard, also known as theSignalyst.
📈POL has been overall bearish trading within the falling channel marked in blue.
Currently, it is approaching the lower bound of the channel.
Moreover, the purple zone is a strong structure and demand.
🏹 Thus, the highlighted blue circle is a strong area to look for buy setups as it is the intersection of support and lower trendline acting as a non-horizontal support.
📚 As per my trading style:
As #POL approaches the blue circle, I will be looking for bullish reversal setups (like a double bottom pattern, trendline break , and so on...)
In parallel, for the bulls to take over long-term, a break above the upper blue trendline is needed.
📚 Always follow your trading plan regarding entry, risk management, and trade management.
Good luck!
All Strategies Are Good; If Managed Properly!
~Rich

TradeWithMky Live Trade on POLUSDTHello there
I just saw a opportinity for long postion in pol ( matic)
if price pass last high i will go long and enter to market
consider its not financial advise its my analysis

Polygon is ready to take off!Hi fellow traders, POLUSDT is ready to make a move higher after completing the complex correction in WXY formation. Target the 0.8414 level. Good luck and trade safe!

#MATIC hourly analysis#MATIC or #POL has a nice pattern in lower time frame there is an obvious M harmonic pattern with a fibo correction of 0.618 binding these 2 together + positive pattern in higher time frame = a huge rising as soon as possible !

Pol Usdt is One of them ( altseason allert ) hello there
in this case i ratter to wait for next confirmation that is pass last resistance that I drow in chart
its not a financial advice its MY ANALYs to tthis chart
good luck and Be safe
#TradeWithMky More than 91% winrate LIVE in Trading View

POL/USDT Trading ScenarioIn November, POL showed confident growth driven by euphoria following the U.S. presidential election results. The asset's price surged from $0.2852 to $0.7705, marking a gain of over 160%. However, profit-taking by market participants soon followed, resulting in a correction that now exceeds 46%.
Currently, seller activity appears to be waning, with a support level forming at $0.4104, from which the price has rebounded twice. Volume profile analysis indicates that POL has stabilized within a zone of market interest.
Further declines may occur as liquidity from short-term players is absorbed, potentially setting the stage for a trend reversal. The recovery dynamics and subsequent growth of the asset are largely influenced by U.S. macroeconomic indicators. Special attention is being paid to the Federal Reserve's decisions on adjusting the key interest rate, which are revised based on current data.

SPOT POL LONG 11.01.2025Pinning after containment of sales.
🎯Purpose:
0.5773
I'll let you know when I record it manually.
‼️Risk per trade: 1% of the allocated funds for spot trading.
Thank you for follow and the reaction🚀.

MATIC is rising #MATIC has an M harmonic pattern which can make a huge rise the market made an ABC pattern which made a reaction to fibo level 0.618

POLUSDT Elliott Waves AnalysisHello friends.
Please support my work by clicking the LIKE button👍(If you liked).
Everything on the chart.
Entry zone: market and lower
Targets: 1 - 1.4 - 2
after first target reached move ur stop to breakeven
Stop: ~0.3 (depending of ur risk).
RR: 1 to 10
ALWAYS follow ur RM
risk is justified
It's not financial advice.
DYOR!

Polygon POS: Big & Big, Big TimeThis one is on my radar as one of the big projects that will grow big, big time. It has huge potential, don't get confused with the targets on the chart, we are talking about huge growth.
Polygon POS is a major player and is now trading at bottom levels which is great. As usual, the market always gives a second chance, another opportunity to get the best prices before the major bull-market and bullish wave.
See the wave that ended in early December.
See how low prices are now and trending lower. This lower trending will produce a huge buy opportunity and we can aim for 10, 15 or even 20X in the 2025 growth period.
The real action started after September 2024 and this can be confirmed by looking at the trading volume. Notice again the trading volume and notice how much lower it is as prices move down, compared to when prices were moving up.
Keep this one in mind and you can thank me later, focusing on long-term growth.
A simple, low risk, stress free strategy of buy and hold. Buy, buy, buy accumulating and hold...
Wait, wait, wait and sell at the top when everything is up.
We will have clear and strong signals when the market peaks. We are talking about 1,000%, 1,500% or even 2,000% potential for profits.
This is only one of the many good choices available across the Cryptocurrency market. This is not a hidden gem and yet it has great potential.
I'll continue to show you some more.
Thanks a lot for your continued support.
Namaste.
