$POLYX Weekly Entry Plan & Technical Analysis Checkout 1DAY TF Entry plan :
-
$POLYX has good support at 0.17, if this support breaks it will go dip more!
Next Weekly strong support at $0.14 & $0.081
For Long term investment you can DCA at weekly support & Target : $0.28-0.42-0.56
Weekly TA :
- Trend & S/R
- Liquidity below weekly Lows
- Elliot 5th Wave
- Double Bottom
Please hit the LIKE button to support my work and share your thoughts in the comment section.
Thanks
@cnb006
POLYXUSDT trade ideas

$POLYX Entry Plan & 1DAY TF Technical Analysis $POLYX short/mid term trade entry : $0.201 & $0.171
Target : $0.259-0.329-0.409
Must use Stoploss at $0.1391 & follow proper risk management!
$POLYX 1Day chart is showing some bullish structures, Like :
- Inverse HnS
- PO3
- S/R
- OB
- Gartley, 3Drive patterns
Please hit the LIKE button to support my work and share your thoughts in the comment section.
Thanks
@cnb006

POLYX is at a nice resistance levelIt is trying to recover after the fall. Some attempts can be made by breaking the yellow resistance level and closing the hourly candle. I am following.

POLYXUSDT Bullish IdeaPOLUX USDT is an very good coin and having very good chart indications. Been in top gainers in last 2 hours to went into Top Looser. Here is very vital Bullish Analysis on POLYXUSDT.

POLYXUSDT.P LONG IDEAhi everyone, as you see on chart, it seems that there is a clear support line around 0.21550 . Also funding rate on binance is negative. it means short positions more than longs. thats why i want to set up long position. i will use 50x leverage in this set up.
entry : 0.21790
stop : 0.21469
take profit : 0.23834
remember that all the ideas belong me is only my idea and it is not financial advice.DYOR.
hope this idea usefull for you. have a nice day.

POLYX ( RWA ) project macro analysis ⏰Expecting potential 15x from here 📌+1500%
📌 Not expecting weekend candle close below the red box ☑️
>< Present price $0.48 :-: but :-: anything below $1 is gift 🎁 from God 💟
" No logic ❌ only magic ✨ bcs " RWA " sector hype goon take this more than OKX:RIOUSDT
👉🏾 Follow and save article with boosting 🚀 for future updates 🚨
💰 Returns calculated from present price

POLYX looks bearishIt looks like a big triangle is forming.
Wave C looks like a triangle and now it looks like we are in wave e of C
If the price reaches the red box, we look for sell/short positions in the red box
We will also look for buy/long positions in the green box.
Closing a daily candle above the invalidation level will violate the analysis
For risk management, please don't forget stop loss and capital management
Comment if you have any questions
Thank You

LONG #POLYXUSDTLONG #POLYXUSDT from $0.35714
15m TF. The coin has formed an upward structure with volumes and compression of price lows, which shows the strength of buyers with a possible continuation of the local trend. There is also a cascade of three resistance levels, each of which has accumulated liquidity.
I am waiting for consolidation near the cascade and acceleration of the deal feed before the impulse movement.

POLYX/USDT.P POLYX
As I mentioned in my chart 22 hours ago. it was a clear short signal and perfectly hit given all Resistanc & Support. Those who understand Charts they know well. And good luck for those who took trade and earn at least some money. I rearly Post Chart. But it's very comfortable feeling.

POLYX/USDT.PThere's support and resistance mentioned on chart.
no doubt it's a strong coin that has potential to move up further but as I see a Support of BTC $65250 is a good if it hold then we see a clear picture towards $68300. So keep eyes ON it.

POLYXUSDT | Testing the New Trading SystemMarket Context
Exciting times as we put our new trading system to the test with POLYXUSDT!
Strategy: Buy the Dip
We spotted a trendline break on the 5M chart and used adjusted Fibonacci levels to set up our limit orders. Here's the plan:
LIMIT Order 1: 0.5169 | TP: 0.5415
LIMIT Order 2: 0.5080 | TP: 0.5163
LIMIT Order 3: 0.5000 | TP: 0.5078
Results
We hit LIMIT #3 and secured a solid 2.53% gain! 🎉
This system is showing promise—let’s see how it continues to perform. Stay tuned for more updates and trades!

#POLYX/USDT#POLYX
The price is moving within an ascending channel pattern on a 1-day frame, which is a retracement pattern
We have a tendency to stabilize above the Moving Average 100
We have an upward trend on the RSI indicator that supports the rise and gives greater momentum, upon which the price depends
Entry price is 0.4973
The first target is 0.5900
The second target is 0.6757
The third goal is 0.7885

POLYX/USDT Has Successfully Broken out of Symmetrical Triangle💎#POLYXUSDT has successfully broken out from a Symmetrical Triangle, positioning it for a potential bullish rally. Currently, with robust momentum at the $0.40 support, there's a high probability for #POLYX to challenge and potentially overcome the resistance level ahead.
💎However, if #Polymesh cannot sustain this momentum and dips below the $0.40 mark, we might see a reversal into a bearish trend. The next critical demand zone at $0.354, renowned for its liquidity and historical upward movements, will be the area to watch.
💎In contrast, if $POLYX revisit this demand zone, it's imperative for the price to achieve a rebound to uphold its support structure. Failure to do so could heighten bearish pressures, worsen market sentiment, and perhaps trigger additional declines in its price.
💎Stay focused and adaptable, Paradisers. Your ParadiseTeam is diligently monitoring the market and ready to guide you through any shifts in the dynamics of #Polymesh.
MyCryptoParadise
iFeel the success🌴

POLYX/USDT on 4H...POLYX is my strong mid-term bet. If you are looking to hold the coin on spot, consider POLYX for the long term. I have 10% of my portfolio in it.

POLYX Bullish Trends and Key Levels: A Technical OverviewLet's delve into the intricacies of this chart for POLYX/USDT and uncover the story it tells. At first glance, the weekly chart exudes a sense of optimism with a recent upward trajectory that's hard to ignore. The price action is encapsulated within an ascending channel, suggesting a bullish trend with higher highs and higher lows.
Key Levels and Trend Analysis
Resistance and Support Zones :
- ** Resistance :** Around 0.5235 USDT, the price has encountered resistance within the upper bounds of the channel. The recent high of 0.7862 USDT marks the pinnacle of this upward move, a crucial level that traders will be eyeing for a breakout.
- ** Support :** The support level at 0.3170 USDT provides a solid foundation for this upward trend. Should the price experience a pullback, this level is expected to offer significant buying interest.
In the chart I reveals that if the volume diminishes, there might be a reversion to the support level, making it a critical area for traders to watch.
Technical Indicators
** Stochastic RSI :**
The Stochastic RSI, currently around 16.16, suggests that the market is in the oversold territory. Historically, these levels have provided lucrative buying opportunities, hinting that we might witness a price surge soon. The blue line crossing above the orange line would further solidify a bullish reversal.
** Cumulative Volume Delta (CVD) :**
The CVD indicator reflects a cumulative value of 126.76M, signaling a balance between buying and selling pressure. A rising CVD often precedes a bullish trend continuation, aligning with our ascending channel narrative.
Chart Patterns and Implications
The price has been consolidating within the beige-colored resistance zone, showing hesitation to break higher immediately. This consolidation phase is crucial as it allows the market to gather momentum for the next significant move. If the price can sustain above 0.5235 USDT with increased volume, we could see a retest of the 0.7862 USDT high or even a breakout toward new highs.
Conversely, if the volume does not pick up, the price might retrace to the 0.3170 USDT support level or even lower, which coincides with the lower boundary of the ascending channel. This level also aligns with the previous consolidation phase, making it a strong support area.
Conclusion
In summary, the POLYX chart is painting a picture of potential and promise. The ascending channel, combined with bullish indicators like the Stochastic RSI and CVD, suggests that the market might be gearing up for another leg higher. However, prudent traders will keep an eye on volume trends and key support levels to navigate any potential retracements.
By staying attuned to these technical cues, one can make informed decisions, whether it's capitalizing on a breakout or buying the dip. The market, much like a narrative, evolves and tells its story—those who listen carefully are often the ones who reap the rewards.

#POLYX/USDT is breaking out of a bullish pennant pattern, and a #POLYX/USDT is breaking out of a bullish pennant pattern, and a successful breakout could lead to a solid bullish wave📈
Price may form new ATH in the near future following the breakout👨💻

LONGTERM ACCUMULATION PATTERNS IN ALT
There are a ton of tickers out there with 2 D Accumulation patterns out there. The timing is the hard part. and BTC can go to W consolidation soon which will change the look of those charts. Daytrading entries off of shortterm Acummulation or Distribution are definitely easier to execute than building longerterm SWING trades .Timeanalysis is a b....e....a...ch!

Did anyone notice the bearish rising wedge?Polyx is an RWA token that has good potential in the future. However, in the short/mid-term I can see a bearish rising wedge even though it is not what I want to see. So, expecting a fall below 0.4 or if it bounces back, there might still be some hope. What do you guys think? Comment below

POLYX/USDT Breakout Done from the Falling Wedge👀🚀💎Paradisers, get ready for a trading opportunity with #Polymesh! We're eyeing a potent breakout from the Falling Wedge pattern. Currently, #POLYX holding strong at the $0.354 support and going to retest the falling resistance of the falling wedge.
💎If #Polymesh doesn’t manage to spring from the $0.354 support and drops beneath it, we expect a possible extension of the bearish trend. The next vital demand zone at $0.315 is known for sparking substantial bullish recoveries thanks to its intense liquidity.
💎Should #POLYX test this demand zone once more, securing a strong rebound is essential to keep up the support. Any failure to do so might boost bearish forces, deteriorate market sentiment, and potentially trigger more price drops.
💎Keep your strategies adaptive and your senses sharp, Paradisers. Your ParadiseTeam is vigilantly monitoring and prepared to steer you through the volatile dynamics of the #Polymesh market.
MyCryptoParadise
iFeel the success

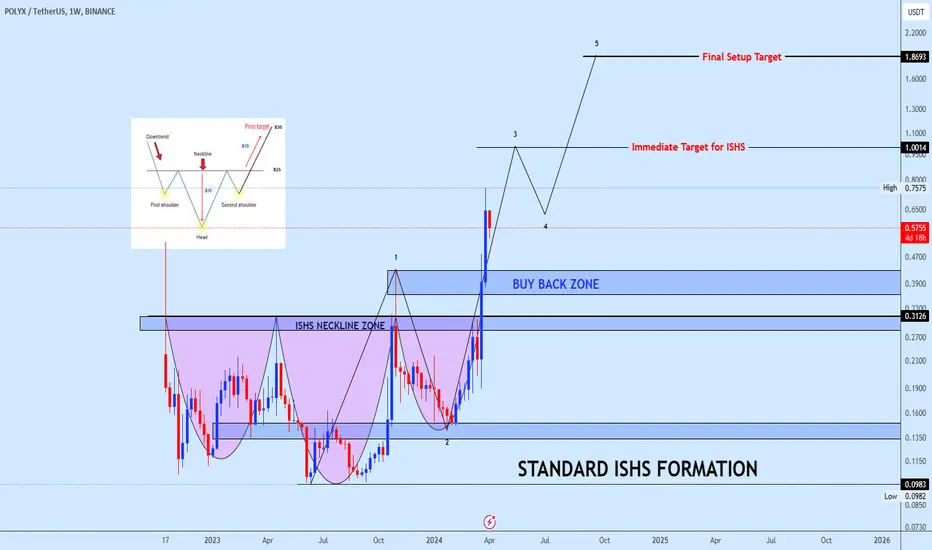
Polyxusdt with huge ISHS formationPolyxusdt is displaying a classic inverse head and shoulders pattern, signaling a potential trend reversal. The breakout above the neckline confirms the pattern's validity. The indicated buy-back zone on the chart presents a favorable opportunity for buyers to accumulate the coin during potential market retracements.
The immediate target for the setup is clearly outlined on the chart, with an extended target serving as the final objective. It's essential to monitor price action closely to capitalize on potential bullish momentum.
Feedback on this coin's analysis and market performance is welcomed and appreciated to further refine trading strategies and decision-making processes.
POLYXUSDT 12HWe have a falling wedge formation on the #POLYX 12H timeframe. Currently, it is facing MA50 and falling wedge resistance. RSI and MACD are good. In case of a breakout, the targets are:
$0.4773
$0.5435
$0.6253
$0.7575
Supports are:
$0.3171
$0.1972

ALL IN on POLYXWe have an inverse head and shoulders, with a breakout confirmed by strong volume.
Our first target is the 2.618 extension at $1.75
Re-entry planned at $1.13 to catch wave 5 up to the 3.618 fib at $2.36
Zero Leverage is being used
There's no stop loss
This is an all in trade.
Good luck traders!

New ProjectsMany market participants have the same problem - holding a profitable position for a long time. For this reason, people don't take away all the movement of the instrument.
You can give reasons, I will re-enter corrections and increase the number of coins -
in 95% of cases, this does not happen
-Profit brings diligence.
-A trader has one goal - to catch the current market trend. That's it.
-You won't start making big money
until you learn to hang on to winning trades,
and the longer you hold on, the greater your profit potential.
-Hold your profitable position as long as possible and close your losing position as soon as possible
Larry Williams
$POLYX $ARKH CRYPTOCAP:JTO NYSE:MAV SEED_DONKEYDAN_MARKET_CAP:PYTH
XETR:ENA NASDAQ:ALT ASX:AEVO
Best regards EXCAVO
