PONDUSDT 1W Analysis POND ~ 1W Analysis
#POND This is the lowest support for now. Buy on a retest of this support block with a short term target of at least 15%+ from here.
PONDUSDT trade ideas

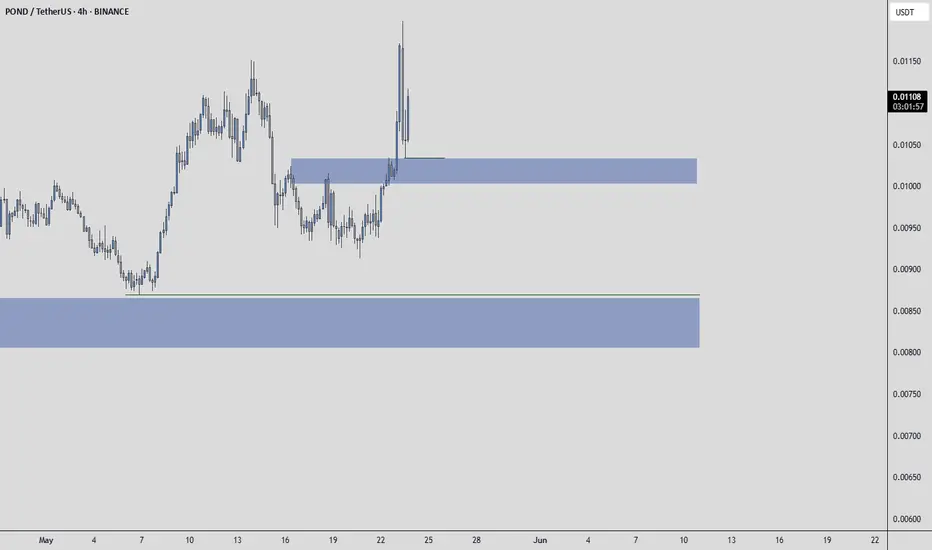
PONDUSDT | Buyers Showing Real PresenceUnlike many altcoins, PONDUSDT is showing clear signs of buyer strength. The blue boxes below represent well-defined demand zones that could reward patient entries.
If you prefer waiting for price to pull into those zones, you're thinking long-term. But even entering here with a market buy isn’t a bad idea, the momentum supports it, and the structure is holding well.
I’ll personally monitor both options, but I never ignore confirmation.
“I will not insist on my short idea. If the levels suddenly break upwards and do not give a downward break in the low time frame, I will not evaluate it. If they break upwards with volume and give a retest, I will look long.”
Whether you're aggressive or cautious, this setup respects both styles, and that’s rare.
📌I keep my charts clean and simple because I believe clarity leads to better decisions.
📌My approach is built on years of experience and a solid track record. I don’t claim to know it all but I’m confident in my ability to spot high-probability setups.
📌If you would like to learn how to use the heatmap, cumulative volume delta and volume footprint techniques that I use below to determine very accurate demand regions, you can send me a private message. I help anyone who wants it completely free of charge.
🔑I have a long list of my proven technique below:
🎯 ZENUSDT.P: Patience & Profitability | %230 Reaction from the Sniper Entry
🐶 DOGEUSDT.P: Next Move
🎨 RENDERUSDT.P: Opportunity of the Month
💎 ETHUSDT.P: Where to Retrace
🟢 BNBUSDT.P: Potential Surge
📊 BTC Dominance: Reaction Zone
🌊 WAVESUSDT.P: Demand Zone Potential
🟣 UNIUSDT.P: Long-Term Trade
🔵 XRPUSDT.P: Entry Zones
🔗 LINKUSDT.P: Follow The River
📈 BTCUSDT.P: Two Key Demand Zones
🟩 POLUSDT: Bullish Momentum
🌟 PENDLEUSDT.P: Where Opportunity Meets Precision
🔥 BTCUSDT.P: Liquidation of Highly Leveraged Longs
🌊 SOLUSDT.P: SOL's Dip - Your Opportunity
🐸 1000PEPEUSDT.P: Prime Bounce Zone Unlocked
🚀 ETHUSDT.P: Set to Explode - Don't Miss This Game Changer
🤖 IQUSDT: Smart Plan
⚡️ PONDUSDT: A Trade Not Taken Is Better Than a Losing One
💼 STMXUSDT: 2 Buying Areas
🐢 TURBOUSDT: Buy Zones and Buyer Presence
🌍 ICPUSDT.P: Massive Upside Potential | Check the Trade Update For Seeing Results
🟠 IDEXUSDT: Spot Buy Area | %26 Profit if You Trade with MSB
📌 USUALUSDT: Buyers Are Active + %70 Profit in Total
🌟 FORTHUSDT: Sniper Entry +%26 Reaction
🐳 QKCUSDT: Sniper Entry +%57 Reaction
📊 BTC.D: Retest of Key Area Highly Likely
📊 XNOUSDT %80 Reaction with a Simple Blue Box!
📊 BELUSDT Amazing %120 Reaction!
📊 Simple Red Box, Extraordinary Results
I stopped adding to the list because it's kinda tiring to add 5-10 charts in every move but you can check my profile and see that it goes on..
Pondusdt Buy opportunityThe previously discussed breakout from the wedge structure on POND propelled the price toward the projected target.
Following this move, a deep corrective phase ensued, bringing the price into a key support zone. This area of interest is expected to serve as a strong re-accumulation zone, while the main supply zone remains a critical resistance level to monitor for potential reversals for bullish continuation.

POND - Probably going offForgot to post this yesterday. As written in the Chart. Idea remains still active.

1.38 RRThis trade, as shown, should be safe--at least an exit in profit should be eventually provided even if it does not hit my target. However, changing the stop and entry among the various levels, a trade with a different risk profile could be created.

PONDUSDT (Marlin) Updated till 23-01-25PONDUSDT (Marlin) Daily timeframe range. 0.01756 defended well we can see the retrace back aftermath. buyers still holding tight. to get out of this range it needs a valid close over 0.02805. if it can long consolidation will push the price up.

#POND: Empowering Decentralized NetworkingDescription:
This trading idea focuses on POND (Marlin), a blockchain-based protocol that optimizes decentralized networking and data transmission for Web3 applications. POND plays a vital role in enhancing network infrastructure by improving bandwidth, reducing latency, and enabling secure and fast communication across decentralized applications (dApps) and DeFi platforms. With the increasing adoption of Web3 technologies, POND is well-positioned to capitalize on the demand for efficient and scalable network solutions. Its partnerships and use cases within the blockchain ecosystem further strengthen its fundamental appeal.
Despite its potential, the cryptocurrency market is highly volatile, with prices influenced by factors such as regulatory changes, technological advancements, and macroeconomic conditions. Investing in POND requires careful risk assessment and a clear understanding of the market dynamics.
Disclaimer:
This trading idea is intended for educational purposes only and does not constitute financial advice. Cryptocurrencies, including POND, involve substantial risks, including the potential for complete loss of capital. Always conduct thorough research, assess your financial situation, and consult with a professional financial advisor before making any investment decisions. Past performance is not indicative of future results.

Prepare to BUY Spot PONDUSDT on D1 CyclePrepare to BUY Spot PONDUSDT on D1 Cycle
🌟 Short-Term Opportunity with PONDUSDT! 🌟
🌍 Market Overview:
PONDUSDT is showing strong potential for upward movement on the D1 timeframe, making it an excellent candidate for short-term gains.
📊 Trade Plan:
📌 Entry Point: $0.026 – Accumulate around this price or lower for an optimal position.
🎯 Target: +30% – Aiming for a solid return within the D1 cycle.
⏳ Hold Time: 5-7 days – Strategically aligned with short-term market movements.
🔍 Strategy Insights:
D1 Momentum Strategy:
Focused on capturing significant moves within a manageable timeframe.
Indicator Confirmation:
Use tools like RainBow MG3 to validate entry points and enhance precision.
💡 Note: This is not financial advice. Always DYOR before trading.
🔥 PONDUSDT is ready for a strong move – Position yourself now! 🔥

My plan BUY PONDUSDT in spot follow up trendThis is my plan BUY BINANCE:PONDUSDT
*Spot assets
I saw Uptrend confirmed signal on H1 timeframe
I saw Break up cloud signal on H1 timeframe
And I saw follow buy signals on chart.
I make a plan BUY this altcoin :
Entry zone: 0.024xx-0.02500
Stoploss : 0.0225
Target : 2R

POND/USDT: Small Waves , Big Ripples, Targeting 20%,60%,100%+To examine POND/USDT for both immediate and long-term prospects:
Key Findings from the Chart: Signal for Trend Reversal:
A possible upward advance is indicated by the most recent green "Buy" indicator.
Because the price is above short-term EMAs, bullish momentum is supported.
Encouragement and Opposition:
Support: The yellow line, or 0.01730, is a strong support.
0.01671 is secondary support.
Resistance: 0.0260 is the immediate resistance.
notable resistance at historical values of 0.03019 and 0.03490.
Momentum & MACD:
Bullish momentum is shown by the increasing green bars on the MACD histogram.
MACD line crossovers are conducive to continuation.
Objectives:
Short-Term Objective:
20 percent first TP: 0.0275.
Entry between current levels of 0.0225 and 0.0230.
Stop Loss (SL): Below the current support level of 0.0170.
Mid-Term Goal:
60 percent second TP: 0.0340.
Long-Term Goal:
100 percent third TP: 0.0420.
In the long run, we can expect significant gains of 150%–200% if the price breaks over 0.0420.
Approach:
Short-term traders should tighten their stop loss at 0.0200 and buy close to 0.0225 with a goal of 0.0275.
Mid-Term Investors: Build up on declines around 0.0173-0.0180 in order to reach 0.034.
Long-Term Holders: For higher returns, wait for a possible breakout over 0.0420.
Risks: Bearish emotion could resurface and render the setup useless if the price drops below 0.0167.

POND/USDT$POND/USDT is trading at $0.02038, showing bullish momentum after breaking out of a descending channel. Key support at $0.01628 provides a solid base for upward movement. The next targets are set at $0.02517, $0.03040, and $0.03482, with a stop loss recommended below $0.01331. If momentum continues, POND is well-positioned for significant gains.
@RosePremiumm

PONDUSDT 1W#POND is moving inside a symmetrical triangle on the weekly chart and is currently facing resistance from the triangle and the Ichimoku cloud. We will buy here and near its support level.
In case of a breakout, the targets are:
🎯 $0.03329
🎯 $0.04967
🎯 $0.06292
🎯 $0.07616
🎯 $0.09501

A trade not taken is better than a losing one!A trade not taken is better than a trade taken from the wrong place.
I find it more accurate and appropriate to wait for this point. The fact that these coins perform well in this atmosphere tells me a lot about their potential.
Don't focus on altcoins in past bulls, new and volume pairs can also do very well. Buy from the right place and wait.

POND May Jump Too?POND had also a strong trend against bitcoin right now -and most alts
EDIT
if you are new to the market
please don't fomo into these pumps !
thank me later 😂 play with 10 bucks if you can help it

PONDUSDTHi , Pond is looking very good bulding power ranging and waiting for the moment to pop off like the last days.
This can be a very fast 100%
Trade at your own risk.

PONDUSDT 1WPOND ~ 1M✅
#POND If you have Conviction on this coin,. Buy gradually after breaking through this resistance line. with a minimum target of 20%+
This trade is high risk. Forget it if you are not interested in this coin.

POND/USDTNice looking setup to go long. Blue lines is my entries. I am hoping for a pullback into that zone to pick up my entries. The zone is a nice orderblock and price needs to mitigate that zone. Solid setup! Might take a day or 3 to develop... but solid as a rock. First higher high is in from the break of structure. Now we go back to create a higher low....and off we go!

PONDUSDT (Marlin) Updated till 26-11-24PONDUSDT (Marlin) Daily timeframe range. 0.01590 defended well now PA trying to break its old resistance at 0.02129. a confirm close above 0.02129 can make it room for its next run. and it got lots of space to cover. recent support still at 0.01590.

$PONDUSDT - Should hold the 0.01632 Support BINANCE:PONDUSDT - I reckon this is a strong support ie 0.01632. Should acknowledge continuation pattern and will move further up. Results should be instant and should be up tomorrow. Best Of Luck

The chart for $POND/USDT #POND/USD
The chart for $POND/USDT suggests a breakout from a descending wedge pattern, signaling potential bullish momentum. Key levels to watch are:
Target 1: $0.03349
Target 2: $0.04249
Support Zone: Around $0.01500, acting as a critical retest area.
Recommendations:
Entry: After retest near the support zone.

Trade Signal: PONDUSDT Sell OpportunityAttention traders! We have identified a promising trade opportunity for the PONDUSDT currency pair. Based on the strategic analysis through the EASY Quantum Ai methodology, we've concluded that the market is set for a downward movement. Here are the details of the trade:
Direction: Sell
Enter Price: 0.01373
Take Profit: 0.01337333
Stop Loss: 0.01411333
Analysis and Justification:
Our prediction is founded on the integration of multiple market indicators analyzed using the EASY Quantum Ai strategy. We have observed a pattern of resistance at recent high levels suggestive of a potential price reversal. This is coupled with a decrease in trading volume, indicating a likely exhaustion of bullish momentum.
Moreover, technical analysis highlights signs of reversal candlesticks formation on the charts, suggesting a potential downturn. Momentum indicators such as the RSI (Relative Strength Index) show overbought conditions, adding further weight to a bearish outlook.
This signal serves as a strategic guide, and as with all trading activities, it's crucial to consider market dynamics and risk management principles. Borders on all levels should be respected to optimize outcomes and safeguard your capital. Happy trading, and be astute to market changes!

PONDUSDTWe can attempt to short PONDUSDT from specified level if it break HL , also there is bearish divergence occur indicate that it moves downward.
SL , TP mention in chart.
