PONDUSDT - Recovery / Continuation PatternAnother AI coin
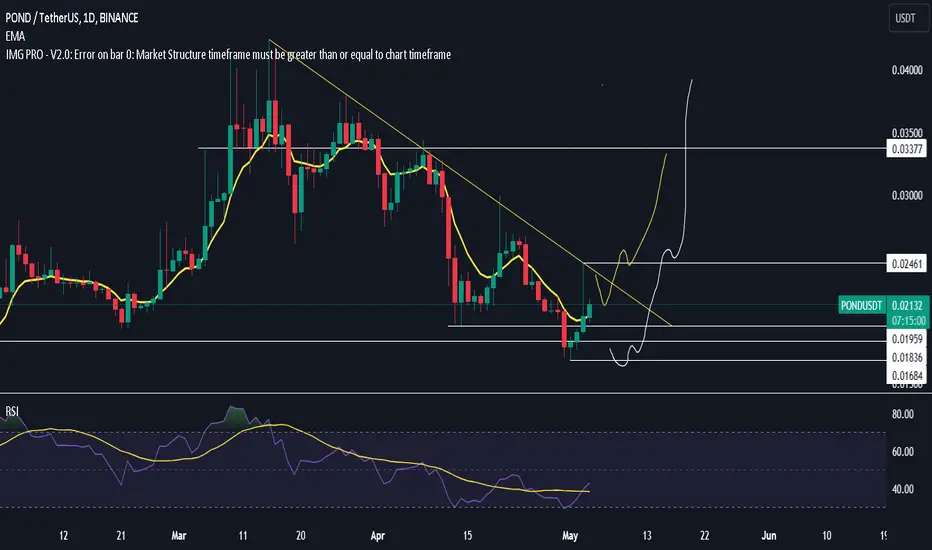
There is a large overarching Inverted H&S structure if you use the flat base as the H for the structure
Price needs to form the right shoulder and then the next move up can continue
Horizontal line is a light resistance for price and is very achievable
Daily chart
PONDUSDT trade ideas

#POND/USDT#POND
The price is moving in a 12-hour bearish channel, is very committed to it, and has just broken through it
We have a green support area at 0.01650 that is expected to be bounced from due to its strength
We have a trend to hold above the Moving Average 100, which is strong support for the rise
We have very strong oversold resistance on the RSI indicator to support the rise with a strong downtrend
Entry price is 0.02300
The first target is 0.02800
The second goal is 0.03260
The third goal is 0.03800

$POND- spot got some of this till weekly close then shall degen back into some perps
long term no brainer spot level to ape into with the rsi crossing the yellow band and a deviation of range low
Dixie has got hammered down and am leaning towards it accelerating down maybe after a bearish retest
so ties in with my 59K sweep theory which could happen .
PONDUSDT.4HOn this 4-hour chart for Marlin (POND) against Tether (USDT), the price action is within a critical area of the Ichimoku Cloud, which can offer insights into the market's momentum and potential support and resistance levels.
Ichimoku Cloud: The price is currently sitting just above the Ichimoku Cloud. If it stays above, the Cloud can act as support, suggesting a bullish trend. A drop below the Cloud could signal a shift to a bearish trend.
Trendlines: A descending trendline is visible, which has been acting as resistance. If the price breaks above this line, it might indicate a potential reversal to the upside.
Support (S1): There’s a support level at the green ascending trendline, which if held, could indicate that the price may continue its uptrend.
Resistance (R1): The resistance level is marked above the current price. If the price reaches this level and fails to break through, it could lead to a potential sell-off.
MACD (Moving Average Convergence Divergence): The MACD is below the signal line, suggesting bearish momentum. However, the histogram is showing less negative momentum, which could indicate the possibility of a trend reversal or consolidation.
RSI (Relative Strength Index): The RSI is hovering just under the midline at around 47, which is neither particularly bullish nor bearish.
Conclusion:
I’d watch the price action in relation to the Ichimoku Cloud and the descending trendline. Maintaining above the Cloud and breaking the trendline could offer a bullish signal, in which case I would consider potential long positions with R1 as a target. If the price falls below the Cloud, I’d be cautious of a bearish trend developing and consider any trades accordingly, potentially looking for short opportunities if the trend confirms. The mixed signals from the MACD and RSI suggest it's a critical moment to be vigilant for confirming signs of the future price direction. Trading decisions should be complemented with other analyses and the latest market news.

Pondusdt Trading opportunityPONDUSDT is exhibiting significant potential following a breakout from a wedge structure. Its primary objective currently resides in testing the immediate internal supply level. A minor rejection is anticipated at this level before a potential breakthrough towards our setup target.
The accumulation zone highlighted is a favorable area housing a majority of orders, presenting an opportune space for coin acquisition.
Your engagement in this post's discussion is valued and appreciated. Thank you.

#PONDUSDT..More Than 280% Bullish Movie Is Pending For PONDI am bullish on PONDUSDT...0.028-0.030 is my target. This is trading into accumulation zone.A big move or Wick can touch 0.028..It's around 280% Upside from current Price..
Feel Free To DM me..


POND Will the formation take place 5x or up more?
cup pattern appears on the weekly Big Chart
Can be considered as a long term investment
For now, I'm taking notes to myself as an observation.

POND - are we fishing a marlin?POND breaks the 0.02 resistance zone, a long term barrier exiting from a stage 1.
possible potential target is 0.045$ level.
But a possible big move is expected.
Good trading

Trade signal | Marlin (POND) completed a setup for the next pumpHi dear friends, hope you are well and welcome to the new trade setup of Marlin (POND) with US Dollar pair.
Previously we caught almost 92% pump of POND as below:
Now on a 4-hr time frame, POND has formed a bullish Gartley move for the next pump.
Note: Above idea is for educational purpose only. It is advised to diversify and strictly follow the stop loss, and don't get stuck with trade.


PONDUSDT(Marlin) Daily tf Range Updated till 05-02-24PONDUSDT(Marlin) Daily timeframe range. trying to cross over 0.02686 if it can clean than not much of holdup till 0.04068. but that needs for retail interest to keep up and a clean daily close.

POND/USDT LONG#POND
The price has been moving in a sideways channel since July 2022
Moving average 100 was broken to the upside
The fracture test was also repeated again
The current price is 0.01470
First target 0.01634
Second goal 0.02012
Third goal 0.02408

POND/USDT Breaking out the Key resistance. Bullish Momentum ???💎 POND has recently experienced significant developments in the market. Presently, POND has achieved a successful breakout of the key resistance area, effectively breaking free from the confines of the accumulation zone resistance.
💎 This development is indicative of a bullish momentum for future movements, with the probability for the price to undergo a retesting phase before continuing its upward trajectory, ultimately targeting the bearish OB area.
💎 However, if during the retesting phase, POND fails to demonstrate a bounce and instead retraces back into the accumulation zone area, this could be interpreted as a false breakout, potentially leading to a downward movement with the likelihood of reaching the demand or support area.
💎 To maintain its bullish momentum, POND would need to bounce from this point and reclaim the price above the accumulation zone area. Failure to do so could result in a continuation of the downward movement, eventually reaching the strong support area.

PONDUSDT in bullish their is no divergence at H1 timeframe PONDUSDT in bullish their is no divergence at H1 timeframe
so we can instant buy and SL below previous HL

PondusdtLong and 1rts target 0.021
2nd target 0.029
No stop lost need
Please trade on your own risk
So first target is daily inducement and 2nd target is 1 OB

Marlin POND Coin Price Prediction🔥 Price on the 4H chart might come at these support area and we might get a potential bounce🔥
Potential bounce areas for Buying 0.01430 and 0.01287
👉 Follow me for More Real Time Opportunities.
Share your Thoughts if you have any?

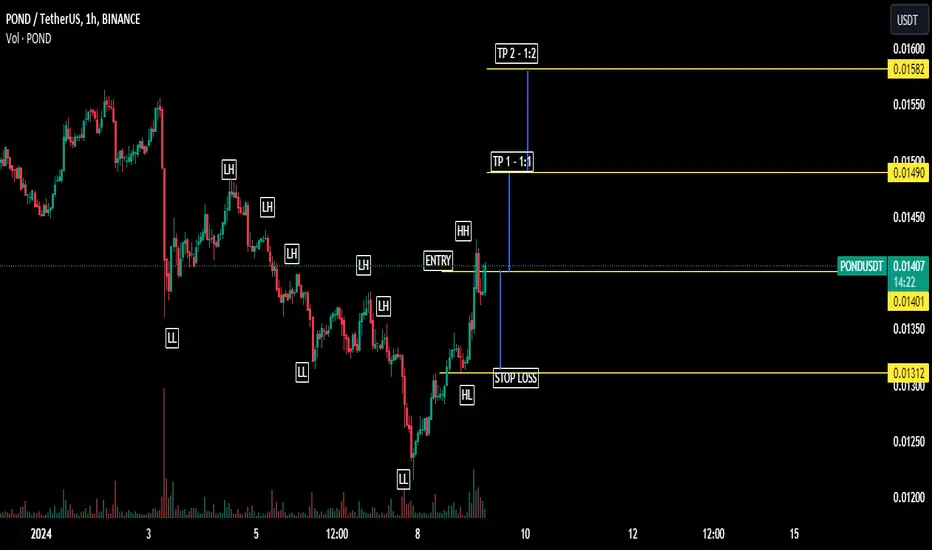
PONDUSDT - BULLISH BREAKOUTPONDUSDT has started trending into a new bullish trend while making new HHs and HLs following DOW Theory. Long positions may be taken.
PONDUSDT - BULLISH OUTLOOKPONDUSDT is exhibiting a bullish trend on the Daily Time Frame, and a bullish divergence is observed on the 1H Time Frame. This combination suggests a potential bullish reversal.
Consider entering the trade within the price zone of $0.01460 to $0.01350
setting a stop loss at $0.01290 to manage risk.
Take-profit levels are as follows:
Take Profit 1 = $0.01630
Take Profit 2 = $0.01800
Take Profit 3 = $0.01970
Take Profit 4 = $0.02140
Take Profit 5 = $0.02310
This trade setup provides a structured approach to potential profit-taking at different levels while considering the predefined stop-loss level. Adjustments can be made based on market conditions and individual risk tolerance.

Trade signal | Marlin (POND) setting up for upto 29.50% pumpHi dear friends, hope you are well and welcome to the new trade setup of Marlin (POND) with US Dollar pair.
Recently we caught almost 92% pump of POND as below:
Now on a daily time frame POND is about to complete a bullish AB=CD move for the next pump.
Note: Above idea is for educational purpose only. It is advised to diversify and strictly follow the stop loss, and don't get stuck with trade.


Marlin (POND) - Hidden bullish divergenceOn the above 1-day price action has corrected 98% from 25 cents in April 2021. Now is an excellent moment to take a long position. Why?
1) The ‘incredible buy’ signal prints.
2) Price action prints a higher lows on the golden ratio. This has not happened since July 2021.
3) Hidden bullish divergence. Of all the divergencies the hidden divergence is the ‘gold standard’. Price action prints higher lows with lower lows in volume. Fantastic.
4) This token is on the ‘what if’ list. In fact this token has already achieved all conditions necessary.
5) On the 2-day POND/Bitcoin pair (below) price action resistance has broken.
6) On the same 2-day chart volume is clearly entering this asset regardless of price action. Someone knows something I don't. Follow the money.
Is it possible price action falls further? Sure.
Is it probable? No.
Ww
Type: trade
Risk: <=6% of portfolio
Timeframe: 2 to 6 months
Return: no idea
2-day chart

PONDUSDT1-Apply your own risk management.
2-Daily and Weekly Targets
3-Hunt the profits at any level you see convenient for you.
4-Gonna SPOT IT WITH 20%Budget
have a good day guys.
