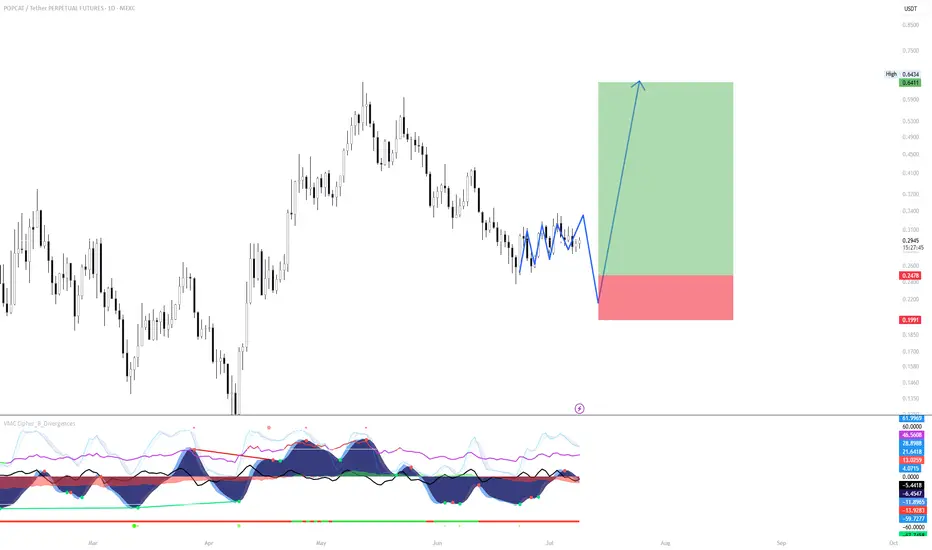
POPCAT/USDT – Tight Range = Engineered Liquidity Grab IncomingPOPCAT is currently consolidating in an unusually tight daily range, with candles compressing into a low-volatility coil. When structure becomes this tight, it often signals that market makers are engineering stop hunts—setting the stage for a larger move.
Thesis:
The current range is likely to bre
POPCAT SHORT TRADE Popcat (POPCAT) is exhibiting a clear downtrend, with recent increases in sell-off volume suggesting continued bearish momentum. The coin has broken through a key resistance level and is consolidating below it, indicating acceptance of the lower price range. Targeting $0.2039 aligns with a previous

POPCAT IDEA 29/06/25Any retracement to the 1D FVG could be a nice entry if you are not in yet
Let´s see how it respond to Premium Zone and we could expect go for mayor liquidity

$POPCAT Bull flag breakout done$POPCAT Breaks Out of Bull Flag – Momentum Building
POPCAT has successfully broken out of its bull flag formation after respecting multiple touchpoints along the descending channel. The breakout confirms bullish continuation and flips prior resistance into support.
Key Levels:
Resistance: $0.38

$POPCAT - Chance of Seeing $1 in Q3
Haven’t posted much about Solana coins lately, but they’re starting to show signs of life again.
$POPCAT had a clear entry right at the weekly FVG below 33c. From here, it either retests the Monthly Open or begins a slow grind higher.
It performed exceptionally well last year, so there’s a good c

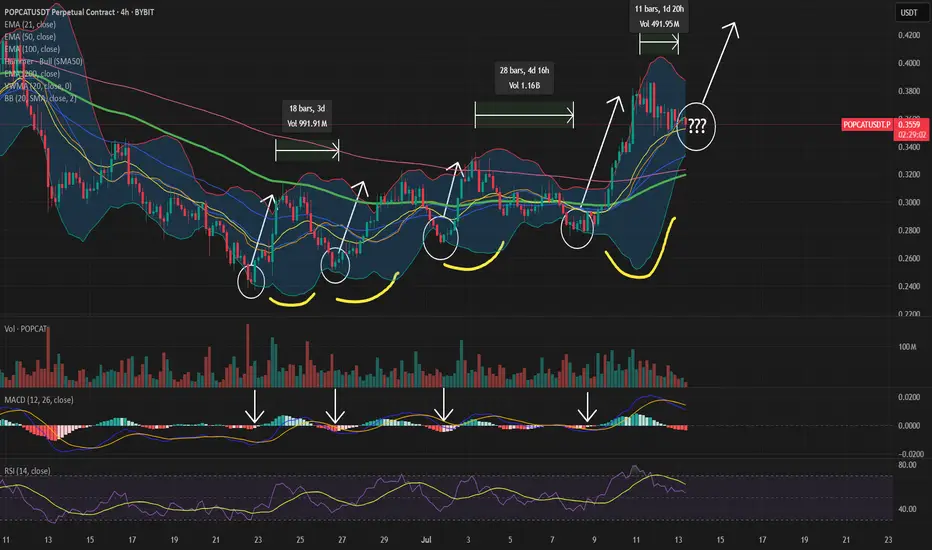
POPCAT - new breakout is coming📈 POPCAT 4H Chart Analysis – Bollinger Bands + MACD
Since 22 June, POPCAT has consistently formed higher highs and higher lows, suggesting growing bullish momentum and a potential breakout in sight.
On the 4H timeframe, POPCAT has followed a recurring pattern:
🔁 Bounce from the bottom of the Bolli
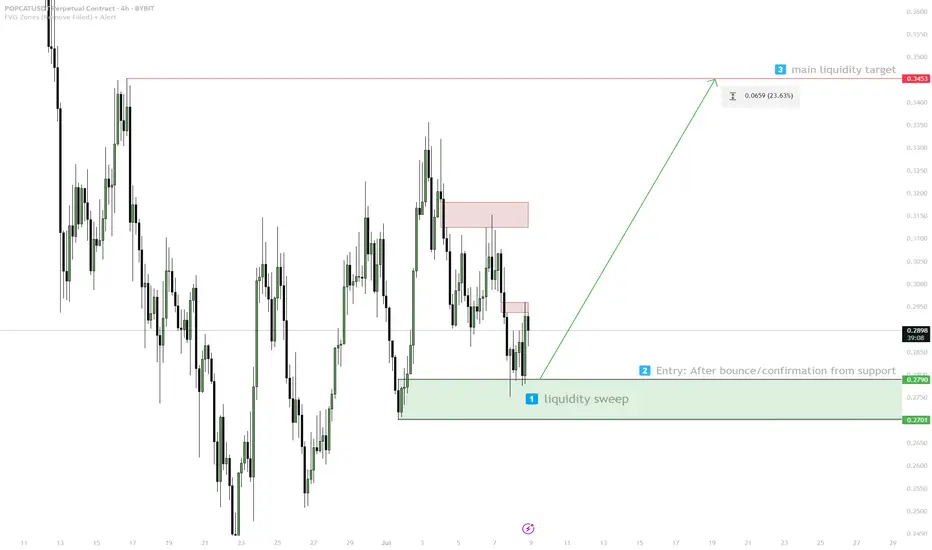
POPCAT — Liquidity Target Play1. Watch for sweep/liquidity grab in 0.270–0.279
2. Enter on confirmed bounce
3. Target: 0.3453 (liquidity zone)
4. Stop: below 0.270 — invalid
POPCAT/USDT — Major Reversal in Play? Strong Bounce
📌 Quick Summary:
Altcoins are starting to show signs of life, and POPCAT/USDT is now sitting at a critical price structure. After a long and painful downtrend since November 2024, the price is consolidating near a powerful support zone — potentially signaling the start of a reversal phase. Is this

my new long trade on POPUSDT.Pi have opened this long trade on POPUSDTp,
please share your thoughts.
not financial advice but rather request for thoughts.

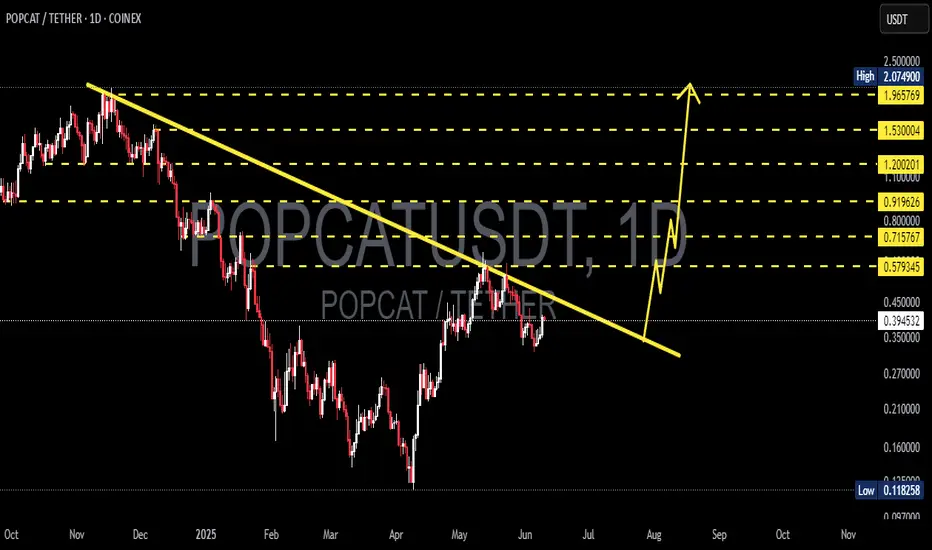
POPCATUSDT 1D AnalysisPOPCAT ~ 1D Analysis
#POPCAT Buy after successfully breaking this resistance line with a short term target of at least 15%+, Long term target $2
See all ideas
Summarizing what the indicators are suggesting.
Oscillators
Neutral
SellBuy
Strong sellStrong buy
Strong sellSellNeutralBuyStrong buy
Oscillators
Neutral
SellBuy
Strong sellStrong buy
Strong sellSellNeutralBuyStrong buy
Summary
Neutral
SellBuy
Strong sellStrong buy
Strong sellSellNeutralBuyStrong buy
Summary
Neutral
SellBuy
Strong sellStrong buy
Strong sellSellNeutralBuyStrong buy
Summary
Neutral
SellBuy
Strong sellStrong buy
Strong sellSellNeutralBuyStrong buy
Moving Averages
Neutral
SellBuy
Strong sellStrong buy
Strong sellSellNeutralBuyStrong buy
Moving Averages
Neutral
SellBuy
Strong sellStrong buy
Strong sellSellNeutralBuyStrong buy
Displays a symbol's price movements over previous years to identify recurring trends.