The POWR may go out and my dear friend Nic will be very sad!POWR token loses support at 765 and if that happens it may tank very rapidly. vol must increase with bearish price action but if that happens it will freefall. Be careful - the SOL token with the intention to "bridge from the erc20" has over 98% held by creator! Due to overall MC this may take a while to play out with slow sideways action. Not worth investing in at this time!
POWRETH trade ideas

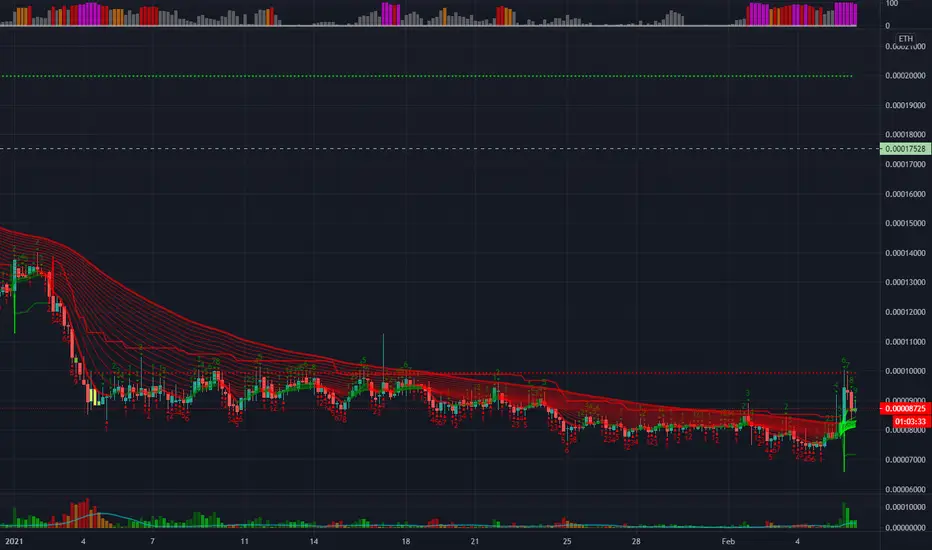
POWRETH { POWER LEDGER } - BULLISH SETUPANALYSIS 🔎
- POWRETH brokeout above the falling wedge's resistance, hit a swing high and retraced.
- Price is retesting the falling wedge resistance and the key fibonacci retracement zone (0.5 - 0.618 - 0.786).
- There's a relatively high concentration of buyers at this zone (high buying pressure).
- Price action is printing the double bottom pattern.
- The double bottom pattern is a bullish reversal pattern.
- We could be at the verge of an uptrend continuation.
BUY ENTRY ⬆️
- Conservative entry: breakout above the double bottom neckline resistance (@0.00011382)
- Aggressive entry: market price.
TARGETS
- Horizontal resistance level (@0.00014705)
- Horizontal resistance level (@0.00017160)
- Fibonacci extension levels.
SETUP INVALIDATION ❌
- Breakdown below the 0.786 fibonacci retracement level.

POWR/ETHPOWR/ETH
Now this crypto coin is in nice momentum. It will go down for a couple of % but once it will make a pullback and breaks its resistance level this could go really nicely up!
In my opinion worth to stake it till the up!

POWRETH (POWER LEDGER) - WEEKLY ANALYSIS ANALYSIS 🔎
- POWRETH is bounded in the major falling wedge pattern.
- The downtrend swing was bounded in the minor falling wedge pattern.
- Price bounced off the major falling support and brokeout above minor falling wedge resistance.
- Possible retest of the major falling wedge resistance.
BUY ENTRY ⬆️
- Market price.
TARGETS 🎯
- Horizontal resistance level (R1).
- Major falling wedge's resistance.
SETUP INVALIDATION ❌
- Breakdown below the previous swing low horizontal support level (S1).

POWR LONGThe long term resistance has been broken. Expecting a 2x or a 3x pump.
The MACD supports the move. Fingers crossed.
The targets are mentioned in the chart keep a stop loss at 10%

POWER BUY SIGNAL AND PULLBACK completeIS POWER ready to start recovery mode?
We can see a nice pullback
Could be an entry
Also USD chart looks good - can even pump today ! Not financial advise
A trading opportunity to buy in POWERETHTechnical analysis:
. PowerLedger/Ethereum is in a range bound and the beginning of uptrend is expected.
. The price is below the 21-Day WEMA which acts as a dynamic resistance.
. The RSI is at 29.
. While the RSI downtrend and the price downtrend in the daily chart are not broken, bearish wave in price would continue.
Trading suggestion:
. There is a possibility of temporary retracement to suggested support zone (0.00060000 to 0.00054000). if so, traders can set orders based on Price Action and expect to reach short-term targets.
Beginning of entry zone (0.00060000)
Ending of entry zone (0.00054000)
Entry signal:
Signal to enter the market occurs when the price comes to " Buy zone " then forms one of the reversal patterns, whether " Bullish Engulfing ", " Hammer " or " Valley " in other words,
NO entry signal when the price comes to the zone BUT after any of the reversal patterns is formed in the zone.
To learn more about " Entry signal " and the special version of our " Price Action " strategy FOLLOW our lessons:
Take Profits:
TP1= @ 0.00065730
TP2= @ 0.00071260
TP3= @ 0.00077540
TP4= @ 0.00083970
TP5= @ 0.00094600
TP6= @ 0.00111160
TP7= @ 0.00155120
TP8= Free

Bullish Power Ledger / Ethereum 1DHello everyone,
A couple of things I want to put out first:
First of all this is my first published idea ever, so if you got any advice or tips feel free to share them in
the comment section. Second the lines I have drawn on the trend are not the best support / resistance
lines, they are purly on what I think (I haven't looked at other ideas), third the lines and the text in the
analysis are a bit messy.
Indicators that are a sign for a bullish uptrend:
1 ) The RSI shows some hidden bullish divergence, higher lows on the trend, and lower lows on the rsi
indicate that the trend keeps rising.
2) The trend broke through the brown line, this means that trend is stabilising or can go in a uptrend.
Don't now for sure.
3) MACD is almost crossing, what can indicate a uptrend.
4) There was a attempt for a breakout, but was canceled.
I think there will be a second attempt to go through the resistance line.
Thank you for ready my first idea. I'm trying to get better at trading and a good way to start is to
publish my ideas and receive some feedback.
P.S I'm also trying to improve my english :)

Long-term Buy trading opportunity for POWERETHTechnical analysis:
. PowerLedger/Ethereum is in a range bound and the beginning of uptrend is expected.
. The price is below the 21-Day WEMA which acts as a dynamic resistance.
. The RSI is at 45.
. While the RSI downtrend and the price downtrend in the daily chart are not broken, bearish wave in price would continue.
Trading suggestion:
. There is a possibility of temporary retracement to suggested support zone (0.00060000 to 0.00054000). if so, traders can set orders based on Price Action and expect to reach short-term targets.
Beginning of entry zone (0.00060000)
Ending of entry zone (0.00054000)
Entry signal:
Signal to enter the market occurs when the price comes to " Buy zone " then forms one of the reversal patterns, whether " Bullish Engulfing ", " Hammer " or " Valley " in other words,
NO entry signal when the price comes to the zone BUT after any of the reversal patterns is formed in the zone.
To learn more about " Entry signal " and the special version of our " Price Action " strategy FOLLOW our lessons:
Take Profits:
TP1= @ 0.00065730
TP2= @ 0.00071260
TP3= @ 0.00077540
TP4= @ 0.00083970
TP5= @ 0.00094600
TP6= @ 0.00111160
TP7= @ 0.00133150
TP8= @ 0.00155150
TP9= @ 0.00186430
TP10= @ 0.00226270
TP11= Free


A trading opportunity to buy in POWERETHTechnical analysis:
. POWERLEDGER/ETHEREUM is in a range bound and the beginning of uptrend is expected.
. The price is below the 21-Day WEMA which acts as a dynamic resistance.
. The RSI is at 50.
. While the RSI and the price downtrend in the Daily chart are not broken, bearish wave in price would continue .
Trading suggestion:
. There is a possibility of temporary retracement to suggested support zone (0.00062400 to 0.00055000). if so, traders can set orders based on Price Action and expect to reach short-term targets.
Beginning of entry zone (0.00062400)
Ending of entry zone (0.00055000)
Entry signal:
Signal to enter the market occurs when the price comes to "Buy zone" then forms one of the reversal patterns, whether "Bullish Engulfing" , "Hammer" or "Valley" in other words,
NO entry signal when the price comes to the zone BUT after any of the reversal patterns is formed in the zone.
To learn more about "Entry signal" and the special version of our "Price Action" strategy FOLLOW our lessons:
Take Profits:
TP1= @ 0.00075400
TP2= @ 0.00088300
TP3= @ 0.00097400
TP4= @ 0.00115000
TP5= @ 0.00132700
TP6= @ 0.00157900
TP7= @ 0.00190000
TP8= Free


POWR/ETH is forming a nice descending wedge patternIn the 1 day chart we can see a beautiful descending wedge pattern for POWR/ETH, with lower highs and lower lows.
RSI is way oversold.
It might find support at the previous lowest point (light-blue line)
Comment your feedback, we're all here to learn! :D


POWRETH - 15m - 2618 Strategy Double bottom is spotted in POWR ETH pair.
If trend continuation follows further,
there is an opportunity now between 0.00074 to 0.00075 eth to go long
Short Target could 1618 inversion 0.0088012 eth
Targets can be divided into stages
Target 1 : 0.0085150 eth - 127/1414 inversion of last leg
Target 2 : 0.0088012 eth - 1618 inversion of last leg
1618 inversion is also providing 127 and 78.6 ratio confluence from previous legs
127/1414 inversion area is also providing 618 ratio confluence from previous legs
RSI indicator with length 5 and upper 79 and lower 21, shows oversold.

power ledger accumulation possible breakoutlooks like a accumulation followed by a possible break out. just need price to break threw resistance.

Double Top POWR/ETHLong-term trend is still intact. Price testing then crossed the 20 EMA . There is confluence between the RSI , MACD price action, however there is divergence in relation to the long-term trendline which remains bullish . I am waiting to see if the price action tests or breaks support at the 0.786 (0.00085436) Fib retracement level and will act accordingly.
Full disclosure - I am still learning TA - Any feedback is always appreciated - I am trading on POWR/ETH and placing orders based on my TA, however, if you do have any doubts in regards my chart, rationale and that fact that I am still learning the craft; please do not buy or sell based on my analysis alone. I would urge you to also look at more experienced members charts before making a decision.
Please note that I deleted the 1st published version of this chart because I thought I had made it private instead of public and didn't know how to change it. This TA is the exact same one. Please forgive my noobness.
Thank you for taking the time to look at my idea.

Bullish Convergence POWR/ETH - Target Price 0.00090000Rising wedge with divergence on the RSI. 150 MA has crossed over the 200 MA. Both 50 and 150 MAs are now on an upward slope. Price action has surpassed the 200 MA. Fib trend extension - Support held at 0.382 (0.00081491) POWR appears to have found support at 0.5 (0.00083297), whether this will hold is still yet to be seen, and has tested resistance at 0.618 (0.00085103). I feel confident that price will exceed 0.00088000, however, a target price of 0.00090000 may be overly optimistic. I believe there is strong enough confluence to support a continuation of an upward trend signaling a bull market.
Full disclosure - I am still learning TA - Any feedback is always appreciated - I am trading on POWR/ETH and placing orders based on my TA, however, if you do have any doubts in regards my chart, rationale and that fact that I am still learning the craft; please do not buy or sell based on my analysis alone. I would urge you to also look at more experienced members charts before making a decision.
Thank you for taking the time to look at my idea.


POWR making a shakey comeback.Always stay bullish on nice dips with promising projects.
Happy Trading~!~!
