POWRUSDT: Mid-Term AnalysisPrice is rising strongly, showing momentum and interest.
The blue box is a fair price to join as a buyer if price pulls back.
I’m not chasing while it’s pumping. If price returns to the blue box, I’ll watch for:
✅ Footprint absorption (aggressive sells met with passive buys)
✅ CDV holding or making higher lows
✅ Structure reclaim for entry confirmation
If these align, I will consider a risk-managed long to ride the trend.
If not, I’ll stay patient and protect capital.
Plan: Let price come to me, act only with confirmation, and manage risk with discipline.
📌I keep my charts clean and simple because I believe clarity leads to better decisions.
📌My approach is built on years of experience and a solid track record. I don’t claim to know it all but I’m confident in my ability to spot high-probability setups.
📌If you would like to learn how to use the heatmap, cumulative volume delta and volume footprint techniques that I use below to determine very accurate demand regions, you can send me a private message. I help anyone who wants it completely free of charge.
🔑I have a long list of my proven technique below:
🎯 ZENUSDT.P: Patience & Profitability | %230 Reaction from the Sniper Entry
🐶 DOGEUSDT.P: Next Move
🎨 RENDERUSDT.P: Opportunity of the Month
💎 ETHUSDT.P: Where to Retrace
🟢 BNBUSDT.P: Potential Surge
📊 BTC Dominance: Reaction Zone
🌊 WAVESUSDT.P: Demand Zone Potential
🟣 UNIUSDT.P: Long-Term Trade
🔵 XRPUSDT.P: Entry Zones
🔗 LINKUSDT.P: Follow The River
📈 BTCUSDT.P: Two Key Demand Zones
🟩 POLUSDT: Bullish Momentum
🌟 PENDLEUSDT.P: Where Opportunity Meets Precision
🔥 BTCUSDT.P: Liquidation of Highly Leveraged Longs
🌊 SOLUSDT.P: SOL's Dip - Your Opportunity
🐸 1000PEPEUSDT.P: Prime Bounce Zone Unlocked
🚀 ETHUSDT.P: Set to Explode - Don't Miss This Game Changer
🤖 IQUSDT: Smart Plan
⚡️ PONDUSDT: A Trade Not Taken Is Better Than a Losing One
💼 STMXUSDT: 2 Buying Areas
🐢 TURBOUSDT: Buy Zones and Buyer Presence
🌍 ICPUSDT.P: Massive Upside Potential | Check the Trade Update For Seeing Results
🟠 IDEXUSDT: Spot Buy Area | %26 Profit if You Trade with MSB
📌 USUALUSDT: Buyers Are Active + %70 Profit in Total
🌟 FORTHUSDT: Sniper Entry +%26 Reaction
🐳 QKCUSDT: Sniper Entry +%57 Reaction
📊 BTC.D: Retest of Key Area Highly Likely
📊 XNOUSDT %80 Reaction with a Simple Blue Box!
📊 BELUSDT Amazing %120 Reaction!
📊 Simple Red Box, Extraordinary Results
📊 TIAUSDT | Still No Buyers—Maintaining a Bearish Outlook
📊 OGNUSDT | One of Today’s Highest Volume Gainers – +32.44%
📊 TRXUSDT - I Do My Thing Again
📊 FLOKIUSDT - +%100 From Blue Box!
📊 SFP/USDT - Perfect Entry %80 Profit!
📊 AAVEUSDT - WE DID IT AGAIN!
I stopped adding to the list because it's kinda tiring to add 5-10 charts in every move but you can check my profile and see that it goes on..
POWRUSDT trade ideas

POWR/USDT IDEAPair: POWR/USDT
Timeframe: 8H
Structure: Descending trendline breakout watch
POWR has been moving within a broad descending structure and is now testing the upper trendline with price pushing into the resistance zone around 0.2000. Momentum is building as it tries to break out of the prolonged downtrend.
Bullish case:
A confirmed breakout above 0.2050 with strong volume could trigger continuation to the upside. If that happens, the next upside levels to watch are 0.2300 and 0.2600. Look for a retest of the breakout level for a safer entry.
Bearish case:
If POWR fails to sustain above 0.2000 and drops back under 0.1800, we might see selling pressure resume with targets back toward 0.1600 and 0.1500.
Price is at a critical decision point. Wait for clear breakout confirmation before taking a position. Set alerts and monitor volume closely.

POWRUSDT: The Power Surge You Can’t Ignore!
📊 Chart Breakdown:
- Current Price: $0.195
- Volume: 199M (Mega whale activity! 🐋)
- Key Levels:
- Support: $0.1400 (Strong floor!)
- Resistance: $0.4000 (Break = Hyperdrive!)
🔥 Creative Analysis:
POWRUSDT just exploded with a 40% pump—but this isn’t just a fluke. The 199M volume screams institutional interest. The chart shows a V-shaped recovery from $0.12, proving dips get bought HARD.
🎯 Big Idea:
"The Energy Rocket" 🚀
- Entry: $0.16 (Aggressive) or $0.145 (Safe retest)
- Targets: $0.22 → $0.28 → $0.34 (FOMO zone!)
- Stop Loss: Below $0.124 (Only for diamond hands!)
💡 Why This Works:
- Volume Confirmation: 199M = REAL demand.
- Symmetrical Bull Flag: Consolidation before next leg up!
- Narrative Power: Energy tokens are HOT in 2025 (Green crypto wave!).
🚨 Meme-Worthy Twist:
"POWR isn’t just a token—it’s a LIGHTNING BOLT waiting to strike! ⚡ Buy now or watch from the sidelines."
📌 Final Thought:
This could be the start of a parabolic run. If it clears $0.38, then $1.00 is in play. Don’t miss the energy revolution!
👍 Like & Follow for more explosive setups! #POWR #GreenCrypto #100xPotential
---
Let me know if you'd like any further refinements! 🚀.
DYOR – this isn’t financial advice, it’s high-voltage hype! 🔋

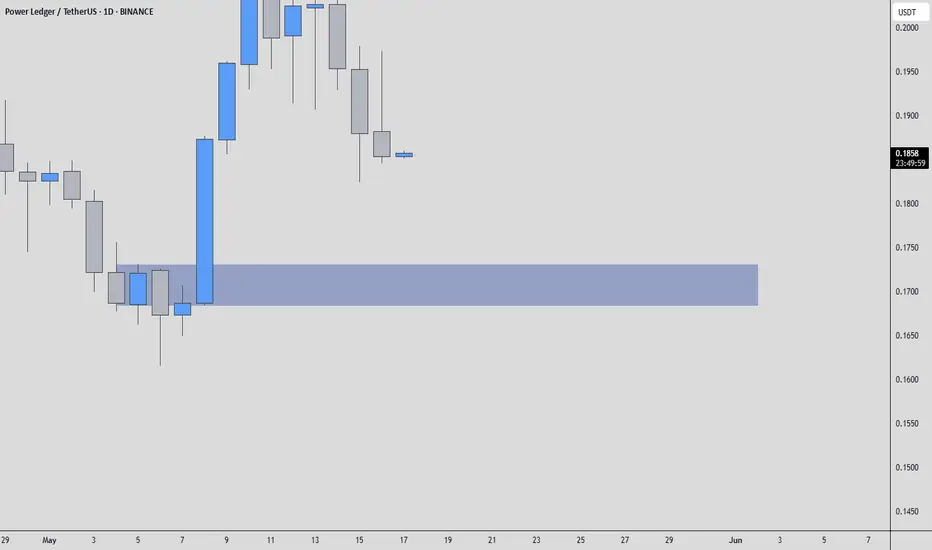
POWR/USDT – One Spot, One SetupPOWR has been grinding sideways, but the real play sits down in that blue box. You know the drill: that’s where liquidity lives, and where smart money often makes its move. There’s no need for extra chatter—just wait for the confirmation trifecta.
First, watch for price to dip into the blue zone. Then look for a volume surge that outperforms the last sell-off, paired with a CDV divergence that signals real buying pressure. Finally, flip over to your low-timeframe chart: a quick break below the box followed by a fast reclaim is your cue. That’s when order flow shifts from sellers to buyers, and you’re in.
“I will not insist on my short idea. If the levels suddenly break upwards and do not give a downward break in the low time frame, I will not evaluate it. If they break upwards with volume and give a retest, I will look long.”
Miss this, and you’ll be left watching from the sidelines. Nail it, and you catch the kind of move most traders only dream about. Keep your eyes on that blue box—when it lights up with those signals, that’s your green light.
📌I keep my charts clean and simple because I believe clarity leads to better decisions.
📌My approach is built on years of experience and a solid track record. I don’t claim to know it all but I’m confident in my ability to spot high-probability setups.
📌If you would like to learn how to use the heatmap, cumulative volume delta and volume footprint techniques that I use below to determine very accurate demand regions, you can send me a private message. I help anyone who wants it completely free of charge.
🔑I have a long list of my proven technique below:
🎯 ZENUSDT.P: Patience & Profitability | %230 Reaction from the Sniper Entry
🐶 DOGEUSDT.P: Next Move
🎨 RENDERUSDT.P: Opportunity of the Month
💎 ETHUSDT.P: Where to Retrace
🟢 BNBUSDT.P: Potential Surge
📊 BTC Dominance: Reaction Zone
🌊 WAVESUSDT.P: Demand Zone Potential
🟣 UNIUSDT.P: Long-Term Trade
🔵 XRPUSDT.P: Entry Zones
🔗 LINKUSDT.P: Follow The River
📈 BTCUSDT.P: Two Key Demand Zones
🟩 POLUSDT: Bullish Momentum
🌟 PENDLEUSDT.P: Where Opportunity Meets Precision
🔥 BTCUSDT.P: Liquidation of Highly Leveraged Longs
🌊 SOLUSDT.P: SOL's Dip - Your Opportunity
🐸 1000PEPEUSDT.P: Prime Bounce Zone Unlocked
🚀 ETHUSDT.P: Set to Explode - Don't Miss This Game Changer
🤖 IQUSDT: Smart Plan
⚡️ PONDUSDT: A Trade Not Taken Is Better Than a Losing One
💼 STMXUSDT: 2 Buying Areas
🐢 TURBOUSDT: Buy Zones and Buyer Presence
🌍 ICPUSDT.P: Massive Upside Potential | Check the Trade Update For Seeing Results
🟠 IDEXUSDT: Spot Buy Area | %26 Profit if You Trade with MSB
📌 USUALUSDT: Buyers Are Active + %70 Profit in Total
🌟 FORTHUSDT: Sniper Entry +%26 Reaction
🐳 QKCUSDT: Sniper Entry +%57 Reaction
📊 BTC.D: Retest of Key Area Highly Likely
📊 XNOUSDT %80 Reaction with a Simple Blue Box!
📊 BELUSDT Amazing %120 Reaction!
📊 Simple Red Box, Extraordinary Results
I stopped adding to the list because it's kinda tiring to add 5-10 charts in every move but you can check my profile and see that it goes on..
Powerledger - The Next STRAX ?POWR has a similar potential with Stratis from a chart analysis perspective.
These coins did hold up well reaching the 2024 summer bottom price range
Targets on chart!

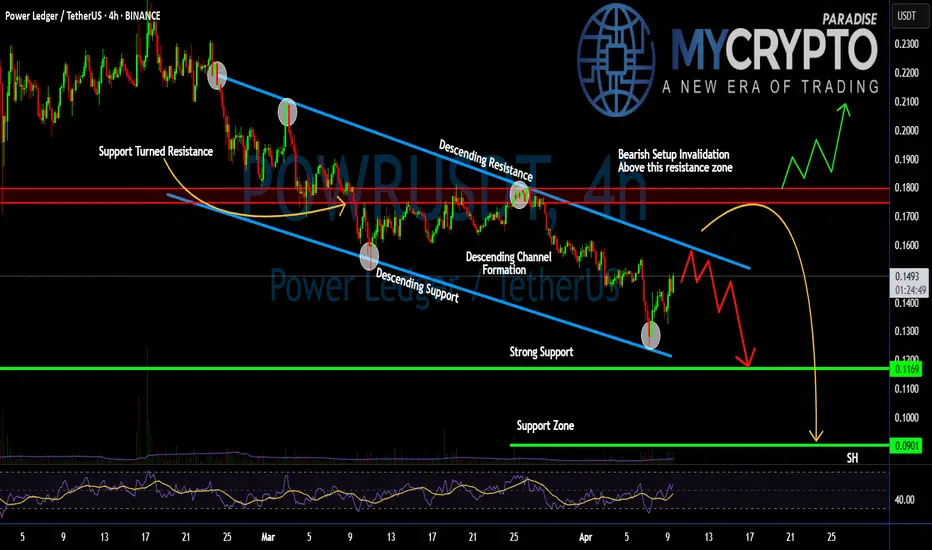
Is #POWR Bouncing Before the Breakdown? Don’t Get Caught Yello, Paradisers. Have you spotted how quietly #POWR is building up a sneaky trap? This move by #PowerLedger could wipe out impatient bulls and overly confident bears in one go:
💎#POWRUSDT is currently trading inside a clean descending channel structure, where both resistance and support levels have been perfectly respected over the past few weeks. The most recent bounce from the lower boundary (around 0.1169) was anticipated, but let’s be clear — this move is still within a bearish market structure.
💎The price is approaching a key resistance level near 0.155–0.160, which also aligns with the descending trendline. A temporary spike higher to test this area — even up to 0.179 — is likely, but don’t get fooled. These types of moves are often engineered to liquidate early short positions before the true direction resumes. Classic bull trap behavior.
💎As long as #POWR remains below the critical resistance zone at 0.180, there is no bullish market shift. This is the invalidation point for any bearish setup — and the price must close and hold above this level to suggest a sustained trend reversal. Until then, this is just another lower high in a broader downtrend.
💎On the downside, the key support levels to monitor are 0.1169, and then 0.0901 — where the strong historical support lies. If the price fails to hold 0.1169, a sharper markdown move into the 0.09 zone becomes increasingly likely. Volume remains muted and momentum indicators are not showing any strong reversal signals yet. Until we see a breakout and confirmation, every bounce is just an opportunity for the market to trap late longs.
Patience and precision are key in these conditions wait for strong confirmation before making your moves.
MyCryptoParadise
iFeel the success🌴
Power is gonna increase It's bullish Power!BINANCE:POWRUSDT
POWER Ledger has formed an ascending Triangle which means the price is gonna increase soon!
No break out yet! but the price will increase accordingly!
⚠️ Disclaimer:
This is not financial advice. Always manage your risks and trade responsibly.
👉 Follow me for daily updates,
💬 Comment and like to share your thoughts,
📌 And check the link in my bio for even more resources!
Let’s navigate the markets together—join the journey today! 💹✨

POWR/USDTKey Level Zone : 0.2980 - 0.3000
HMT v4.1 detected. The setup looks promising, supported by a previous upward/downward trend with increasing volume and momentum, presenting an excellent reward-to-risk opportunity.
HMT (High Momentum Trending):
HMT is based on trend, momentum, volume, and market structure across multiple timeframes. It highlights setups with strong potential for upward movement and higher rewards.
Whenever I spot a signal for my own trading, I’ll share it. Please note that conducting a comprehensive analysis on a single timeframe chart can be quite challenging and sometimes confusing. I appreciate your understanding of the effort involved.
Important Note :
Role of Key Levels:
- These zones are critical for analyzing price trends. If the key level zone holds, the price may continue trending in the expected direction. However, momentum may increase or decrease based on subsequent patterns.
- Breakouts: If the key level zone breaks, it signals a stop-out. For reversal traders, this presents an opportunity to consider switching direction, as the price often retests these zones, which may act as strong support-turned-resistance (or vice versa).
My Trading Rules
Risk Management
- Maximum risk per trade: 2.5%.
- Leverage: 5x.
Exit Strategy
Profit-Taking:
- Sell at least 70% on the 3rd wave up (LTF Wave 5).
- Typically, sell 50% during a high-volume spike.
- Adjust stop-loss to breakeven once the trade achieves a 1.5:1 reward-to-risk ratio.
- If the market shows signs of losing momentum or divergence, ill will exit at breakeven.
The market is highly dynamic and constantly changing. HMT signals and target profit (TP) levels are based on the current price and movement, but market conditions can shift instantly, so it is crucial to remain adaptable and follow the market's movement.
If you find this signal/analysis meaningful, kindly like and share it.
Thank you for your support~
Sharing this with love!
HMT v2.0:
- Major update to the Momentum indicator
- Reduced false signals from inaccurate momentum detection
- New screener with improved accuracy and fewer signals
HMT v3.0:
- Added liquidity factor to enhance trend continuation
- Improved potential for momentum-based plays
- Increased winning probability by reducing entries during peaks
HMT v3.1:
- Enhanced entry confirmation for improved reward-to-risk ratios
HMT v4.0:
- Incorporated buying and selling pressure in lower timeframes to enhance the probability of trending moves while optimizing entry timing and scaling
HMT v4.1:
- Enhanced take-profit (TP) target by incorporating market structure analysis

POWRUSDT 1WPOWR ~ 1W
#POWR Buy gradually within this support block, if you still have Conviction on the coin. With a minimum target of 20%++

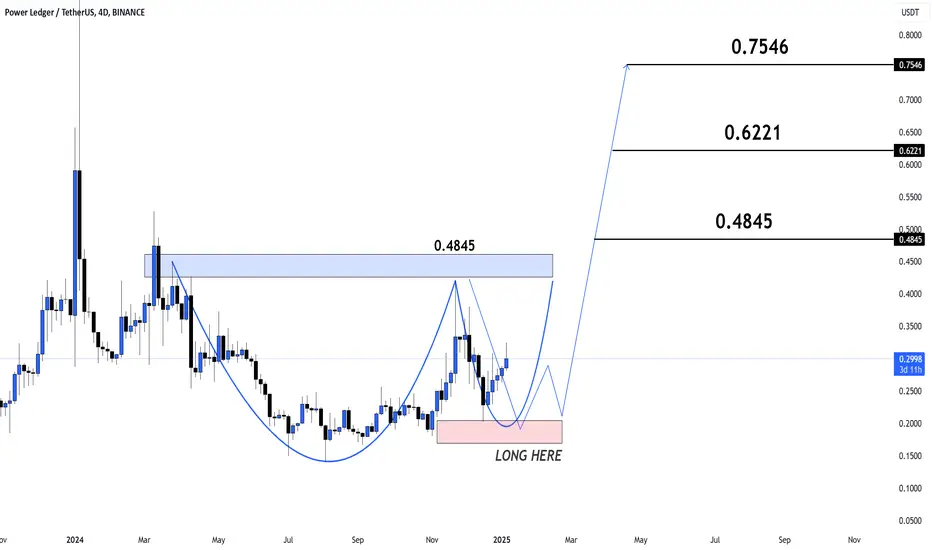
POWER is gearing up for a breakout!
#POWER USDT is forming a clean cup-and-handle pattern and approaching the key breakout zone at $0.4845 👀
Targets are set at $0.6221 and $0.7546, indicating significant upside potential 🎯
In my opinion, this setup has strong momentum, and BSE:POWER could rally hard once the breakout confirms 🚀
POWR/USDTKey Level Zone :0.2760 - 0.2780
HMT v3.1 detected. The setup looks promising, supported by a previous upward/downward trend with increasing volume and momentum, presenting an excellent reward-to-risk opportunity.
HMT (High Momentum Trending):
HMT is based on trend, momentum, volume, and market structure across multiple timeframes. It highlights setups with strong potential for upward movement and higher rewards.
Whenever I spot a signal for my own trading, I’ll share it. Please note that conducting a comprehensive analysis on a single timeframe chart can be quite challenging and sometimes confusing. I appreciate your understanding of the effort involved.
Important Note :
Role of Key Levels:
- These zones are critical for analyzing price trends. If the key level zone holds, the price may continue trending in the expected direction. However, momentum may increase or decrease based on subsequent patterns.
- Breakouts: If the key level zone breaks, it signals a stop-out. For reversal traders, this presents an opportunity to consider switching direction, as the price often retests these zones, which may act as strong support-turned-resistance (or vice versa).
My Trading Rules
Risk Management
- Maximum risk per trade: 2.5%.
- Leverage: 5x.
Exit Strategy
Profit-Taking:
- Sell at least 70% on the 3rd wave up (LTF Wave 5).
- Typically, sell 50% during a high-volume spike.
- Adjust stop-loss to breakeven once the trade achieves a 1.5:1 reward-to-risk ratio.
- If the market shows signs of losing momentum or divergence, ill will exit at breakeven.
The market is highly dynamic and constantly changing. HMT signals and target profit (TP) levels are based on the current price and movement, but market conditions can shift instantly, so it is crucial to remain adaptable and follow the market's movement.
If you find this signal/analysis meaningful, kindly like and share it.
Thank you for your support~
Sharing this with love!
HMT v2.0:
- Major update to the Momentum indicator
- Reduced false signals from inaccurate momentum detection
- New screener with improved accuracy and fewer signals
HMT v3.0:
- Added liquidity factor to enhance trend continuation
- Improved potential for momentum-based plays
- Increased winning probability by reducing entries during peaks
HMT v3.1:
- Enhanced entry confirmation for improved reward-to-risk ratios

#POWR / USDT#POWR / USDT
CSE:POWR is consolidating near its support zone, forming the "handle" of the cup pattern. If the price maintains this level and breaks out, it is expected to test $0.4845 (T1) first, followed by $0.6221 (T2) and ultimately $0.7546 (T3) as part of the bullish trend.
Entry Zone: Enter long positions between $0.2200 and $0.2436.
Stop Loss: Below $0.2000 to minimize risks.
Take Profit: Gradually at $0.4845, $0.6221, and $0.7546.

#POWER (SPOT) IN( 0.1900- 0.2550)T.(0.7200) SL( 0.1802)BINANCE:POWRUSDT
Entry ( 0.1900- 0.2550)
SL 1D close below 0.1802
T1 0.3400
T2 0.5000
T3 0.7200
______________________________________________________________
Golden Advices.
********************
* collect the coin slowly in the entry range.
* Please calculate your losses before the entry.
* Do not enter any trade you find it not suitable for you.
* No FOMO - No Rush , it is a long journey.
Useful Tags.
****************
My total posts
www.tradingview.com
1Million Journey
www.tradingview.com
www.tradingview.com
**********************************************************************************************
#Manta #OMNI #DYM #AI #IO #XAI #ACE #NFP #RAD #WLD #ORDI #BLUR #SUI #VOXEL #AEVO #VITE #APE #RDNT #FLUX #NMR #VANRY #TRB #HBAR #DGB #XEC #ERN #ALT #IO #ACA #HIVE #ASTR #ARDR #PIXEL #LTO #AERGO #SCRT #ATA #HOOK #FLOW #KSM #HFT #MINA #DATA #SC #JOE #RDNT #IQ #CFX #BICO #CTSI #KMD #FXS #DEGO #FORTH #AST #PORTAL #CYBER #RIF #ENJ #ZIL #APT #GALA #STEEM #ONE #LINK #NTRN #COTI #RENDER #ICX #IMX #ALICE #PYR #PORTAL #GRT #GMT #IDEX #NEAR #ICP #ETH #QTUM #VET #QNT #API3 #BURGER #MOVR #SKL #BAND #ETHFI #SAND #IOTX #T #GTC #PDA #GMX #REZ #DUSK #BNX #SPELL #POWR

#POWR Ready For a Pullback or Will it Keep Falling? Key LevelsYello, Paradisers! Could #POWRUSDT be gearing up for a breakout, or will it fail to hold critical support levels? Let’s dive into the key areas of #PowerLedger:
💎#POWR has been trading in a descending channel formation for most of 2024, steadily making lower highs and lower lows. However, recent price action suggests a potential shift in momentum, signaling an opportunity for the bulls to step in.
💎The demand zone between $0.1856 and $0.2577 remains the critical level to monitor. This area has consistently provided strong support, and as long as the price stays above this zone, the bullish outlook remains valid. A sustained hold here would strengthen the case for a move higher.
💎If the price holds this demand zone and begins a reversal, the first target is the supply zone around $0.3500–$0.4500, which has acted as a key resistance in the past. A decisive breakout above this level could propel POWR toward its major resistance zone at $0.8000, opening up a potential rally to even higher levels.
💎That said, caution is essential. A daily candle close below $0.1856 would invalidate the bullish thesis and could trigger a sharp correction, exposing the price to further downside risk. In such a scenario, #POWR may revisit sub-$0.1350 levels, potentially shaking out weak hands before finding a new equilibrium.
Stay focused, patient, and disciplined, Paradisers🥂
MyCryptoParadise
iFeel the success🌴

Alikze »» POWR | Bullish Wave 3 or C Scenario - 1D🔍 Technical analysis: Bullish Wave 3 or C Scenario
📣 BINANCE:POWRUSDT is moving in an ascending channel on the weekly time frame, currently in the upper area of the ascending channel.
🟢 It is currently testing the current supply area, which can continue to grow up to the specified range of 88 cents with the support of the middle of the channel and the green box.
🟢 Considering that it is in the third ascending step or C, it can break the current supply area and continue to grow as wide as the first channel to the second channel.
💎In addition, if the green box area is broken, the blue bar can act as the next support to cause demand.
⚠️If a correction occurs and the green box area is broken, the price should not enter the Invalidation LVL area, in which case the bullish scenario will be invalidated⚠️
»»»«««»»»«««»»»«««
Please support this idea 💡 with a LIKE 👍 and COMMENT 💬 if you find it useful and Click "Follow" on our profile if you'd like these trade ideas delivered straight to your email 📧 in the future.
Thanks for your continued support.🙏
Best Regards,❤️
Alikze.
»»»«««»»»«««»»»«««

POWRUSDT LONGAs price respected over pervious levels and it came down to 1hFvg grabbing liquidity we might see a upside climb

POWRUSDTHi friends
i made this position in ichimuko & order block systems...
you can check it...
one note her that you can find more positions in private section here or our channel
best regards...

POWR/USDT Looking GreatPower/USDT is showing potential for a breakout from a symmetrical triangle pattern on the 8-hour time frame. A solid breakout could happen soon. If the price breaks out and successfully retests the breakout level, we might see a surge of 40-80% in the coming days. Keep an eye on this movement, as it could be significant. This is not financial advice—please do your own research.

Power Ledger Strong Volume & Long-Term Growth (2,144% Potential)Power Ledger (POWRUSDT) is another Altcoin pair that has been growing long-term, forever; higher highs and higher lows.
The dynamic is clearly shown on the chart and the last bullish wave that peaked in January 2024 produced a little bit more than 1,550% growth, which is amazing.
When the August 2024 long-term higher low came in it produced the highest volume ever, an exaggeration. The session closed green. Seeing this huge volume and the huge 2023/24 bullish wave indicates that this will be one of the pairs to grow super strong in 2025, you can see the targets on the chart.
Remember our strategy is pretty simple.
First, we only recommend spot trading for beginners and intermediate. No margin, no leverage; no risk.
Second, we buy and hold focusing on the long-term. If prices drop, we buy more. If prices drop again, we either buy more or simply wait depending on our finances.
What remains of 2024 is set for buying and buying only, we consider selling only in 2025 after strong growth.
There are also strategies for the short-term, chart setups for the short-term and trades for the short-term but we are not talking about those. The general and main strategy is buy and hold.
The biggest portion of your capital can be used to build a portfolio based on spot pairs. A smaller portion for short-term trades and an even smaller portion for leveraged trades.
We start with the spot and long-term, easy; set it and forget. Buy and hold. Let the market take care of the rest.
As we see our capital grow and we get used to the market, we start buying and selling, that's ok.
When we become experts at buying and selling successfully through spot, we can consider leveraged trades.
This is not financial advice.
This is my experience that I am sharing with you after years of being in the market.
Thank you for reading.
Your support is appreciated.
Namaste.

long powr nowsee rsi 3 touched the 30 level and 35 rsi is above 50 level bullish
should go up higer check on fibonacci and higer time frames for possible targets dyor

$POWR.PAs you know, in my outlook - gray area is my entry for buy/sell (long/short) area and red line is my stop loss. Purple is target.
Always DYOR and manage your own risk.

#POWER/USDT#POWER
The price is moving within a descending channel pattern on the 4-hour frame and is expected to rise after it has been largely committed to it
We have a downtrend on the RSI indicator that is expected to break upwards and we have a trend to stabilize above it
We have a major support level in green at a price of 1900
We have a trend to stabilize above the moving average 100
Entry price 0.1920
First target 0.2046
Second target 0.2176
Third target 0.2346

POWRUSDT | UP THIS WEEK!I’m feeling bullish about this week for crypto, and POWRUSDT is looking primed for an upward move. Here’s why:
Market Momentum
• ETH ETF Launch: With the ETH ETF trading this week, we’re expecting a ripple effect across the altcoin market. 🚀
• Crypto Sentiment: The market is buzzing with optimism, and altcoins like POWR could ride this wave.
Technical Setup
• CHoCH Formation: POWRUSDT recently created a Change of Character (CHoCH), signaling a potential reversal and bullish momentum. 📈
Strategy
I’m aiming for a solid 1.78:1 Risk-Reward ratio, which is quite promising given the current setup.
Action Plan
Long on POWRUSDT, leveraging the positive market sentiment and technical signals. With the ETF launch potentially sparking a broader market rally, this could be a golden opportunity.
Let’s ride the wave and see how high we can go! 🚀✨
Good luck, everyone!
