Powerusdt Breaks Falling WedgeFalling Wedge Breakpout Already Confirmed Expecting Massive bounce Soon
Place Sl Below Black Line You Can Enter According Your Strategy
POWRUSDT trade ideas
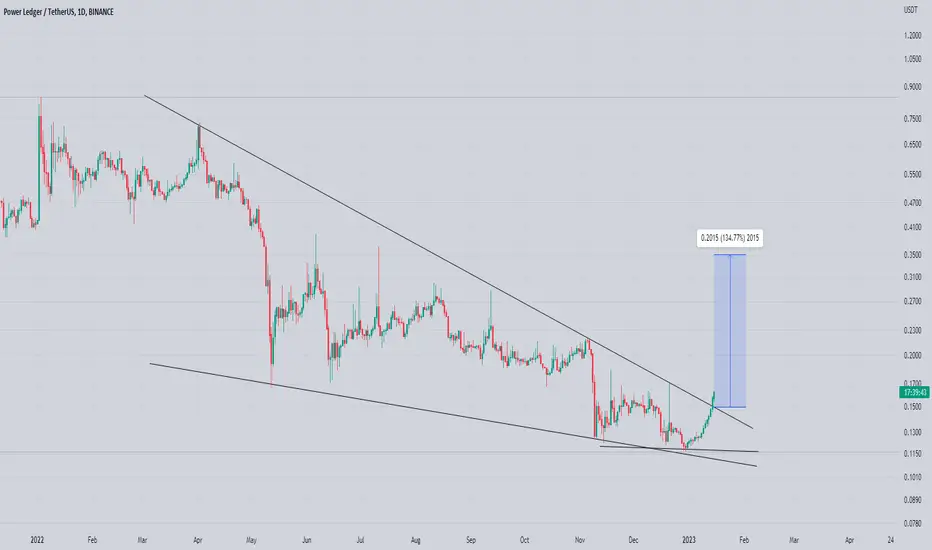
Powrusdt Looks Good Forming Falling Wedge In daily Timeframe
Rsi Printed bulish Divergence Too (indicating Bounce)
We Only Needs Confirmed Breakout Of falling wedge Only After Breakout Entry Would Be Valid
Best Stoploss Area Can Be Below Wedge

POWR/USDT LONG IDEA 🚀🚀Hi guys , it's a spot swing trade
Entry1: 0.1480
Entry2: 0.1380
Tp1 : 0.16
Tp2: 0.1720
SL: 0.13
Please like my idea and follow me for more strong signals

Powerledger (POWR) forming bullish Cypher for upto 32% pumpHi friends, hope you are well and welcome to the new trade setup of Powerledger (POWR) with US Dollar pair.
Previously I shared a trade plan for POWR, but stil powr is moving in the potential revesal zone, and dragged too much.
Now on one hour time frame, POWR is about to complete another bullish Cypher pattern.
Note: Above idea is for educational purpose only. It is advised to diversify and strictly follow the stop loss, and don't get stuck with trade

Power Ledger (POWR) - July 18Hello?
Welcome, traders.
By "following", you can always get new information quickly.
Please also click "Like".
Have a good day.
-------------------------------------
(POWRUSDT 1W Chart)
Whether the 0.2364-0.2885 zone is supported and able to rise is the key.
(1D chart)
Bollinger Bands are starting to contract.
Therefore, volatility is expected in the near future.
At this point, we need to see if we can break through the upper Bollinger Bands by moving above the 0.2885-0.2979 section.
The key is whether the 0.2204-0.2364 zone can support and rise.
------------------------------------------------------------ -------------------------------------------
** All indicators are lagging indicators.
Therefore, it is important to be aware that the indicator moves accordingly as price and volume move.
However, for the sake of convenience, we are talking in reverse for the interpretation of the indicator.
** The MRHAB-T indicator used in the chart is an indicator of our channel that has not been released yet.
** The OBV indicator was re-created by applying a formula to the DepthHouse Trading indicator, an indicator disclosed by oh92. (Thanks for this.)
** Support or resistance is based on the closing price of the 1D chart.
** All descriptions are for reference only and do not guarantee a profit or loss in investment.
(Short-term Stop Loss can be said to be a point where profit and loss can be preserved or additional entry through split trading. It is a short-term investment perspective.)
---------------------------------

POWRUSDTWhat is Powerledger (POWR)?
Powerledger (POWR) is a technology company that builds software for distributed and decentralised energy markets for a sustainable future. It has developed a blockchain-based platform that enables the tracking and trading of energy, flexibility services and environmental commodities. Its goal is to provide the platform for a fully modernized, market-driven grid that offers consumers a choice in their energy while driving the democratization of power.

POWR\USDT 📐Symmetrical Triangle📐Hello friends👋
A Symmetrical Triangle has formed on the 1D timeframe📐, the lower border has been broken👊 and tested, I expect a further decline to the level of 1.618 Fibonacci✅
I will be grateful for the likes👍 and comments✍️.


PowrusdtSeems bullish we need to break the down trendline , Every thing on the chart except entry and stoploss
Entry 49-55
Stoploss
Daily close below 47

🆓Powerledger (POWR) Mar-19 #POWR $POWR
POWR has just broken out of the short-term downtrend and has also conquered the $0.5 zone, which is a good opportunity for POWR to advance to the $0.6 zone. The resistance areas of POWR are usually quite weak because it can easily have flash pumps so we need to book profits first to avoid losing profits.
📈RED PLAN
♻️Condition : If 1-Day closes ABOVE 0.5$ zone
🔴Buy : 0.5
🔴Sell : 0.6 - 0.7 - 0.85
📉BLUE PLAN
♻️Condition : If 1-Day closes BELOW 0.5$ zone
🔵Sell : 0.5
🔵Buy : 0.42 - 0.35
❓Details
🚫Stoploss for Long : 10%
🚫Stoploss for Short : 5%
📈Red Arrow : Main Direction as RED PLAN
📉Blue Arrow : Back-Up Direction as BLUE PLAN
🟩Green zone : Support zone as BUY section
🟥Red zone : Resistance zone as SELL section

POWRUSDT, PREDICTION MAY COME TRUE...!
---------------------------
I personally expect a similar move to the side trend roof...

Buy Signal in POWRUSDTPOWRUSDT get rise in Vol in last past daily and 30mins with little R in 4H ,,
Vol increase IN POWRBTC so i think will get nice pump in USDT

POWRUSDT is testing the 0.618 Fibonacci LevelThe price is testing the 0.618 Fibonacci level between two main daily structures.
As you can see the market got a rejection from the dynamic resistance and it's trying to have a breakout.
How to approach?
We are waiting to see a clear breakout of 0.58$ level with volume, According to Plancton's strategy , we can set a nice order
–––––
Keep in mind.
🟣 Purple structure -> Monthly structure.
🔴 Red structure -> Weekly structure.
🔵 Blue structure -> Daily structure.
🟡 Yellow structure -> 4h structure.
–––––
Follow the Shrimp 🦐

Finonacci Circles Identified on POWRPOWR is on a strong uptrend on all timeframes.
I forecast that it will dip to retest the support line in the triangle pattern before breaking out bullish.

Buy POWRUSDT @ 0.5921RB fixed value @ 100
TP @ 0.7
Price shoots up and comes back at the demand zone.
MACD is above the zero line.
Buy.

powrusdt chart recappersonal analyses . a bit too risky.
so triangle is obvious.
you can see head and shoulders.
just monitor the volume and hopefully you can make a decision !
good luck

POWRUSDT long against the trendLooks like POWR could be pushing back up.
On the shorter time frame it's just completed 12345abc cycle or a 1'st and 2'nd wave on the 2H or 4H time frames.
The purple dotted lines are some of the previous peaks that also looks good with some fib levels I played with.
If this next wave up is a 3'rd wave and a bigger than the 1'st there's a target and if the whole things plays out a new ATH will be the next target just south of the 1$.
All very optimistic!
Please draw your own lines and conclusions and feel free to let me know where I went wrong.

POWR can make a rebound with 35% to 60 %as we see correction is almost done
rebound can make a huge pump to 65 cents or retest 80 cents again
stop-loss if you want
below 47 rebuy again from 42
Good Luck

