Trading Ideas For PSE Stocks, FX, Crypto, US Stocks And OilI will try and post more trading ideas here in tradingview for forex, crypto, US stocks, Philippine Stocks, Metals, And Oil.
My trading principle is all about keeping your losses small. You take small losses to get to your wins and let the game of probability do its work. No prediction. Let the price move and react.
PSEI trade ideas

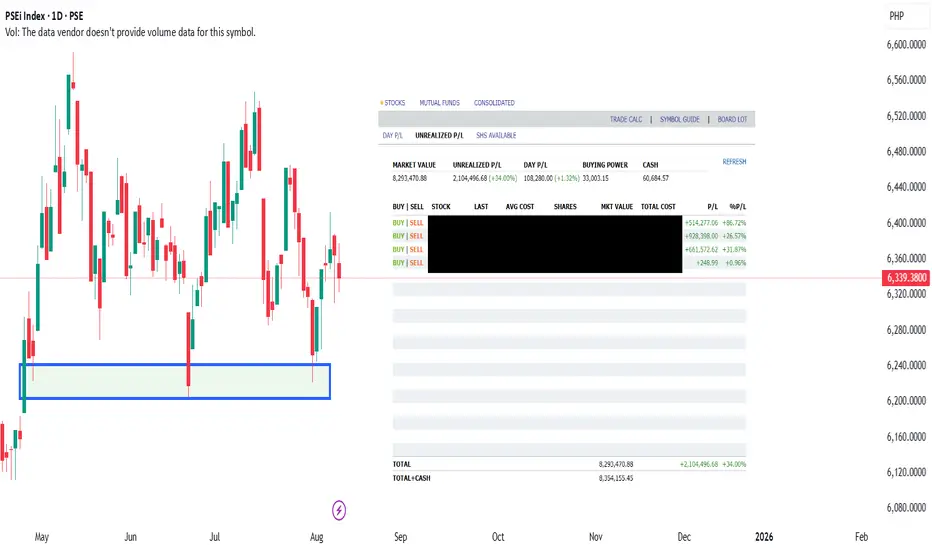
PSEI On Its Way To RecoveryPSEI has not yet fully recovered ever since Pandemic. The price attempted several times to break the support zone but failed. I managed to made some good trades near support levels. I am riding some stocks as the market recovers. I have over 2.1 Million pesos or 113,000 usd if you convert it to dollars. I will be locking in half of these profits and ride the rest. I plan to trade more as the market recovers. Online Gambling stocks are a hot national topic now in the Philippines but the real growth that will fuel the recovery will be on the banking and property sector. They are the ones that was hit badly by the Pandemic and they will most probably supercharge the Philippine market's recovery. Goodluck to all. May you trade well.
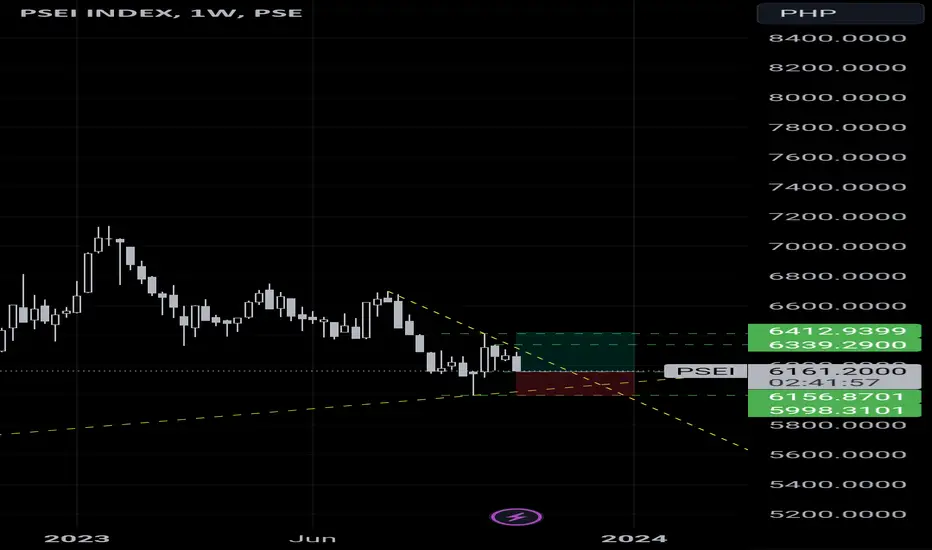
Make Up Your Mind Already, PSEi!Since 2020, the PSEi has been trading within a range between 5,700 and 7,600. I have been tracking the 5-year consolidation via various 3-wave corrective waves. If the count is correct, we should be close to a capitulation of sorts before the next big move.
After what I count as the completion of both Wave b circle and Wave (i) of the larger Wave c circle, I think we are a couple of months away from the completion of Wave (ii) (refer to shaded square area). If this is indeed a Wave (ii), then what follows after its completion is a convincing decline that will likely pierce through the 5-year support level of 5,700. Such price action will signal the start of a mediium-term bear market for the Philippine market.
Furthermore, chart pattern-wise, you can see in the Weekly Chart a possible Double Top forming by considering the 2022 and 2024 highs (7,500+) as the corresponding tops.
Although it is less probable, the alternative move would be for the PSEi to break above the current consolidation (shaded square area). More price action is needed to determine whether this alternative move will signal the start of a more sustainable bullish move. Too early to say; hence, I believe this move to be the less probable scenario.
Therefore, I continue to watch the PSEi; especially as it moves closer to the 5,700 area. The bearish scenario continues to be my personal bias since the current market consolidation (shaded square area) remains to be nearer to the low-end of the 5-year range.

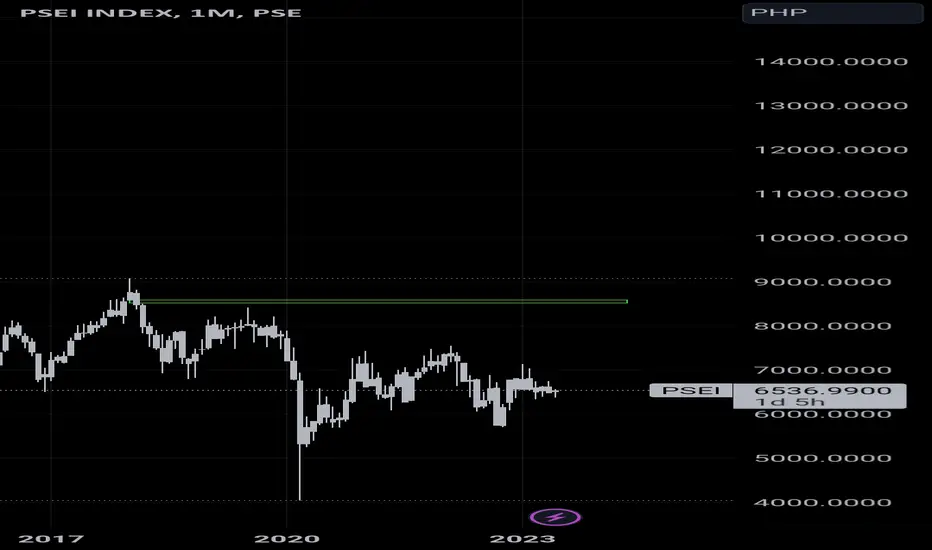
PSEi Index - Long-Term Technical OutlookChart Overview:
The monthly chart of the PSEi Index (Philippines Stock Exchange Index) presents a crucial technical setup, reflecting long-term historical price action, key support/resistance levels, and potential future movements.
Key Observations:
Current Price & Trend:
The index is currently trading at 6,180.72, experiencing a sharp decline of -5.33%.
Price is below a key resistance level of 6,695.81, indicating a bearish phase.
Major Support Levels:
4,039.15: A significant long-term support level.
439.53: An extreme historical low (unlikely to be revisited).
Major Resistance Levels:
9,078.37: A key breakout level for a bullish reversal.
13,285.55: A major resistance from previous highs.
20,069.49: Long-term upside target in case of a bullish breakout.
Potential Scenarios:
Bullish Case:
If the price reclaims 9,078.37, a rally towards 13,285.55 and eventually 20,069.49 could unfold.
A breakout above 13,285.55 would signal a strong bull market.
Bearish Case:
If the index loses support at 6,180.72, it could decline towards 4,039.15.
Further downside could expose the market to a deep correction.
Technical Indicators & Sentiment:
The market is currently consolidating near historical support.
If buyers step in, a strong upward reversal is possible.
Failure to hold current levels may result in further downside.
Conclusion:
The PSEi Index is at a critical juncture. A breakout above 9,078.37 could trigger a strong uptrend, while a breakdown below 6,180.72 increases the probability of testing lower support levels. Traders should watch for volume confirmation and price action near key levels before making decisions.

Macro Monday 51 ~ The Philippines - The Trading Hub of AsiaMacro Monday 51
The Philippines – The Trading Hub of Asia
The Philippine economy is currently the fastest-growing economy in South East Asia with solid promising growth projections for the next several years. The World Bank's Global Economic Prospects report on East Asia and the Pacific showed that the Philippines and Cambodia will be the second highest growing economies in East Asia and the Pacific, next to Palau which is projected to grow by 12.4%.
10 Reasons to consider the Philippines for significant investment returns:
1. The GDP growth rate in the Philippines was 7.6% in 2022 and 5.6% in 2023. The International Monetary Fund (IMF) raised its GDP growth forecast for the Philippines to 6.2% for 2024, as reported in their latest World Economic Outlook. This forecast is within the government’s revised 6-7% growth target. This puts the Philippines up there with India, the Ivory Coast and Ireland in terms of their GDP growth rate, all of which are some of the fastest growing economies in the world.
2. The population of the Philippines is 119 million with 28% (33 million people) of the population between the ages of 10-24, giving the country a sustained future labour market edge. The current labour market holds its own with 55% of the population between the ages of 20 – 64 (64 million people). Similar to India, the labour force is young, capable and likely to be sustained.
3. The Philippines are semiconductor specialists. The largest export of the Philippines is semiconductors. Semiconductors make up a significant portion of the Philippines’ exports, accounting for approximately 31.9% of the total electronic products exports. Electronic product exports in turn represent nearly 63% of the country’s total exports.
4. Additional to the above electronic products, the Philippines are also major exporters of manufacturing machinery and equipment, making them similar to South Korea in this respect (covered a few weeks ago). Broadly Manufactured Goods contributed the largest to the country’s total exports in January 2024 amounting to $4.83 bln or a share of 81.4 %. The Philippines are major machine and tool manufacturers (think Caterpillar Inc), however electronic products and semi-conductors are their forte making up the majority of their exports.
5. The second largest export of the Philippines is coconut oil, which has shown a significant annual increase in export value. It is one of the top commodity groups after electronic products in terms of export earnings.
6. The Philippines have a broad customer base in terms of exports. Their largest trading partner was the U.S. with an export value amounting to $902.3 million or a share of 15.2% to the country’s total exports in January 2024. The remaining top five major export trading partners for this month with their export values and percent shares to the total exports were;
a. Japan - $869 million (14.6%);
b. Hong Kong - $761 million (12.8%);
c. People’s Republic of China - $625 million (10.5%)
d. Republic of Korea - $356 million (6.0%).
7. The Philippines has made remarkable progress in reducing poverty over the past three decades. According the World Bank the poverty rate has fallen by almost 80% between 1985 to 2024 and this is expected to continue. According to the World Bank the current poverty rate is 10.7% however, the official poverty rate methodology in the Philippines is different and indicates that 18.1% of people live below the national poverty line. Of the employed population, 2.2% earn less than $1.90 per day on purchasing power parity (PPP) as of 2022. Regardless based on the Philippines methodology a target of <9% in expected to be hit by 2028 - set by the leading President Ferdinand R. Marcos.
8. Major Foreign Investment Incentivisation. The Philippines adopts an open economy that allows 100% foreign ownership in most business sectors. Many government corporations are getting privatized and the major industries such as telecommunications, energy, banking, and shipping have been deregulated. This gives foreign investors more freedom to set up operations in the country. In 2023, the Philippines saw a 6.6% decrease in FDI net inflow, totalling $8.86 billion, which was slightly higher than the targets set. For 2024, there has been a reported increase in FDI net inflows, with a 23.1% rise in March compared to the same month in 2023. The net inflow for March 2024 was $686 million.
9. Strategic Location. For investors aiming to tap into the ASEAN Free Trade area’s vast market of over 600 million consumers, or to engage with the key economies of East Asia, including China, Japan, and Korea, the Philippines offers an ideal strategic position. Additionally, the nation’s prime location at the nexus of numerous global maritime and air routes makes it an excellent hub for integrating into the worldwide supply chains of various enterprises. Think of it as the versatile and dynamic Suez Canal of Asian trade with reduced regulation.
10. Finally, there are a number of additional other factors make the Philippines ripe for investment and growth;
A. The Philippines boasts a high literacy rate of 94.6%, ranking third globally, with English widely used in education, media, business, and daily life, following Filipino (Tagalog) as the national language. This is similar to Ireland in Europe, which is also the only native English speaking country remaining in the EU since UK’s exit - Brexit. This gives these countries a trading edge.
B. The country’s growing economy is complemented by low business start-up costs, with labor and operational expenses significantly lower than in Western countries, leading to substantial cost savings for foreign companies establishing back offices and development centers.
C. One of the world’s largest archipelagos, the Philippines is rich in natural resources, ranking among the top gold and copper producers, with diverse marine and land species unique to its thousands of islands, alongside stunning tourist destinations.
Bonus Note on President Rodrigo Duterte:
It would be remiss of me to not mention the previous President Rodrigo Duterte who took a very harsh approach to resolving drug related crime in the Philippines. According to the Philippine Drug Enforcement Agency, during 216,138 anti-illegal drugs operations conducted between July 2016 and September 2021, 311,686 people were arrested and 6,201 were killed by the police Whilst controversial, this low tolerant approach resolved and remedied a major drug and crime issue that Philippines was burdened with. This has made the country as a whole more appealing for nationals and tourists.
Duterte also increased infrastructure spending to an average of 5 percent of the country’s overall GDP – this is twice the budget in the administrations that came before him.
As you can tell from all of the above, the Philippines is staged to enter into a monumental period of growth. The Philippine Stock Exchange also suggests that the stage is set, lets have a look.
The Philippine Stock Exchange - PSE:PSEI
The PSE Composite Index (PSEi) is composed of the 30 largest and most active common stocks listed at the PSE.
The Top 5 Companies in the PSE are as follows;
1. SM Investments Corporation: A conglomerate with operations in retail, property, and financial services. It is one of the largest companies in the Philippines by market capitalization. Market Cap of $17 bln.
2. SM Prime Holdings (SMPH): One of Southeast Asia’s largest integrated property developers, offering lifestyle cities with malls, residences, offices, hotels, and convention centers. Market Cap of $13 bln.
3. BDO Unibank: The largest bank in the Philippines by assets, loans, and deposits. It offers a full range of banking services and products to the retail and corporate markets. As of June 2024, BDO Unibank has a market cap of $12.11 billion.
4. Golden MV Holdings: A company that develops memorial parks and columbarium facilities in the Philippines. It also engages in real estate through its subsidiary Bria Homes, Inc. Market Cap of $12 bln.
5. International Container Terminal Services Inc. (ICTSI): A leading operator of container ports and terminals in the global trade and shipping industry. Market Cap of $11.7 bln.
We might look at a couple of these company charts later in this article and possibly more in coming days.
The PSEi Index chart I am about to share reminds me of the Brazil Emerging Market ETF Index AMEX:EWZ chart which we previously shared weeks ago. It also looks a little like the AMEX:URA chart and or U.S. Small Cap 3000.
All these charts are forming long term pennants and breaking to the upside. We are still pending a decisive move on the PSEi below.
▫️ You can observe a compressing pennant with a breakout very likely approaching. Given the positive strides being made in the Philippines I am leaning towards a bullish break out in the above, however this will likely be a measure and slow move.
▫️ If this chart moves in the right direction and gets above its 21 day moving average we can presume the market is moving in the right direction in the Philippines and thus seek out some companies to invest in, knowing that the wind is at our back.
▫️ Investing in the above would obviously leave you exposed to a currency risk in the Philippine Peso. So you need to keep an eye on that currency pair.
▫️ The above chart is not a prediction, however it does have a double bottom look about it and with that in mind, there is a back end potential for an up to 12% currency gain in a longer term trade for U.S. investors. It’s a very interesting background set up.
▫️ This means if you invest in Filipino stocks or companies, there is potential here that you might get additional %’s from the back end currency play.
▫️ Equally, if we lose the current low on the Peso, this would lead to losing potential gains, the currency risk in the trade. So you need to watch both charts if you enter a trade.
Very important to keep an eye on the Philippine Peso if you’re an international investor converting your local currency into Pesos in order to invest in companies in the Philippines, however at present the chart looks like it might be an advantageous back end play. No Guarantees.
Now lets look at a Philippine Stock that is large, liquid and heavily relied upon by multiple sectors in the Philippines and obviously we need a DAMN GOOD CHART.
International Container Terminal Services - SET:ICT
▫️ The chart speaks for itself and presents a good 6:1 risk: reward set up.
▫️ That 100 SMA can provide a nice structural support for anyone wanting to stay in the trade longer or at least have a level that if convincingly lost, you can cut your losses. Equally the 100 SMA would also be a great entry level.
▫️ The above SET:ICT chart reminds me so much of the Reysas LoJistik BIST:RYSAS chart which is a similar business in logistics and transportation but in Turkey. Please have a look below.
COMPARISON
Reysas Lojistic - BIST:RYSAS
▫️ I am sharing this chart as a reference to potential outcomes for ICT.
▫️ Very Similar Company Sector and Chart to the above ICT Chart in Philippines. Could we see similar continued advances in ICT?
There are a number of REALLY interesting chart set ups for the Top 5 companies in the Philippine Stock Exchange (we shared these tickers earlier). I will definitely add these in coming days and weeks as I see a lot of opportunity in the Philippine market place and the currency looks like it might be about to gain positive ground.
It appears the Philippines is undergoing an monumental economic renaissance with the economic and demographic landscape looking incredibly favourable for this versatile archipelago. This nation of Islands is presenting an incredible investment opportunity, so great in fact, I’ve started looking at property there. It has so much potential and appears to be on the cusp of a major bull trend. We can watch the PSE chart and wait for the break out.
All these charts are available on my TradingView Page and you can go to them at any stage over the next few years press play and you'll get the chart updated with the easy visual guide to see how the Philippine stock market has performed. I hope it’s helpful.
PUKA

Break above the rangeLooking forward to bullish this December because of business flourishing because of fundamentals by people demanding more from suppliers by orderering more goods and services because of the holidays.

Discount priceAs December nears, and more people come, i expect a breakout to the long because of influx of Philippines currency from abroad and scheduled parties and events in the Philippines.
Ber season is good for business.
$PSEI clean chart cyclethis chart shows a clean cycle count. the question is, is this wave 1? or wave x of a bigger correction? this clear wave count suggest that the index is going up.
Goodluck PH stock traders.

Undervalued PseiBecause of the China issue, trust in asia stocks etc., is going down, but the intelligent invester will remember, Philippines is not China.
As things are improving under the Marcos regime, it's best to be among the few who buys in now and hold for a net profit early.

I wonder what cause may push psei upThere is a monthly imbalance here, meaning sometime int he future, price may go up. Of course there will be a lot of volatility of ups and downs in the short term that we need to hurdle, but this one takes the cake.
So far, businesses are back. People are going to school and work. The basic transportation, electricity, food, clothing and shelter demand is being met too. So in the long run it'll go up.
But i guess it's simply a waiting game.
Psei weekly bearCurrent price is under both 20 and 50 ema. Showing Philippine sentiment to be under previous weeks.
6610 is the level to break.
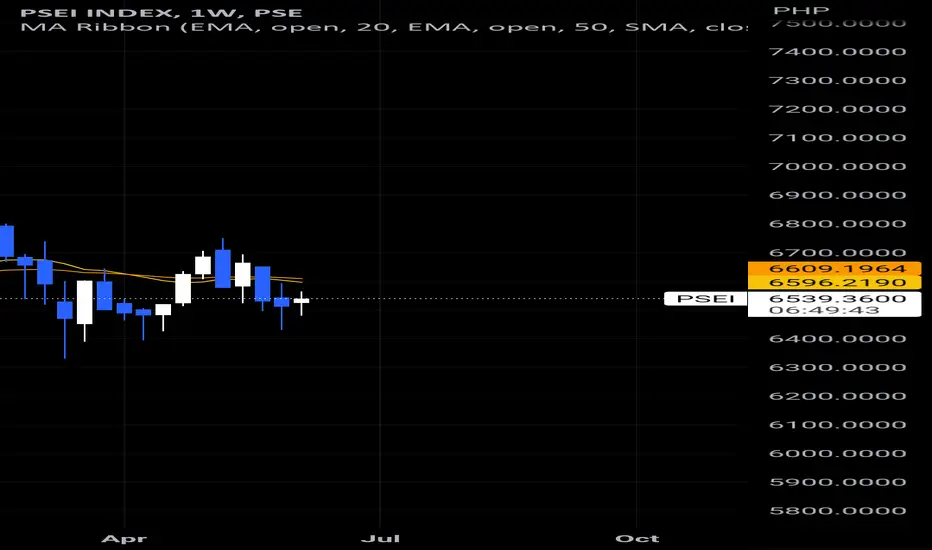
Psei bearBecause of bank fears, people probably took out their money.
Know that these are the best times to invest if you have extra funds.

Psei in the floorPicture says a thousand words.
Will it bounce like before? Or dive down?
Time will tell.

Fake or clear break for PSEi? (Analysis for 13 to 17 Feb 2023)PSEi has approached and continued to hold the 6.8k level as seen in yellow. Strong level for a resistance, now turning support. There seems to be a strong indication that it will be bullish for the week. It is critical to see how the price action will evolve in this area of value.
With PSEi's tendencies to mirror US indices, it may potentially also mirror the reaction in the upcoming CPI results on Tuesday. Additionally, PH interest rate decision is due on Thursday.
I think PSEi will give room for a swing higher and to break the 7,140 level. However, it may also give an indication of fake one. Or just simply wait for more concrete data and range between 6.6k to 6.8k
My stand in the short term is to see this swing move to 7k and see if it will continue the bullish channel. Let's see how this goes!

Psei on phase 2All info priced in, current price on phase two tapping the support. Will it bounce or go down? We don't know. All we know so far is that price is hovering the support on phase two and may go up.

Usd php breach of lineBecause price breached the trend line, its going down. Why? Because dollar is getting stronger because of possible interest rate increase.

Philjppines Psei monthly longWhy?
1. Lower highs, higher high.
2. Reflects the positive growth of the country
3. Weekly agrees
4. Daily agrees
This is a nice momentum


PSEI moving upXmas season causing spending causing spike for demand for good and services causing overall outlook for companies to increase.
Price action is consolidating just in time for a break for a long direction. And candle marking a hammer is forming.

$PSEI possibly to retest <3.5K?$PSEI now on Tradingview. If growth is worst than expected might possibly see <3.5k to 2.6K as strong support area. Immediate resistance at 7.4K. Trade cautiously everyone.

PSEI continues to be sold offTrend Analsysis continues to tell us to avoid the general indices for now if one wants easy trades. When will it stop? Not sure for now.


