Extremely Oversold Looking to BounceTEL has already lost P76bn in market cap, 22% down since the chart breakdown from 1,600, and 29% from its most recent high. RSI readings are extreme oversold. The sell-off emanates from news that it had overspent CAPEX by P42bn in the last 4 years since 2019. The company is undergoing a major management shake-up and had suspended its CFO among other officers. I believe the sell off ha overdone and the market cap loss is over and above the 42bn overspend in CAPEX. Traders may want to put in some money into a bounce in the next few days. Stop: 1200. TP: 1480 and 1600.
TEL trade ideas

PHI - buyable gap up as by the rules of GILMOGil Morales is along Mark Minervini - one of my virtual teachers. Their methods are my go to methods when it comes to running analysis and performing trades.
PHI has shown a 'buyable gap-up" where the stock moved higher on Dec 17th on increased volume and keeps above the gap level. The Stop Loss for such a setup would be locate an the bottom of gap bar (altough in his book Gil does not recommend using this level as hard target - as that might be 'shakeout').
Happy trading to All!


PLDT STOCK UNDERVALUEDYOU CAN SELL NOW IF U WANT, DUTERTE WILL LOCK DOWN THE PHILIPPINES NEXT WEEK OR SO.

PHI, Long 12.2%, over 3.4 Risk/RewardWe may get a breakout of the channel. RSI made a V style bounce on the 45 zone, MACD stays bullish above 0.
If breakout is confirmed, we could buy at 25.9$ and sell when reaching the 29.10$ resistance with maybe some profit taking at the 27.10$ resistance.


PHI - Fallen angel type Long from $28.33 to $32 and higherPHI looks a nice fallen angel pattern. Technically it seems a Very good long opportunity.
Trade Criteria
Entry Target Criteria- Break of $28.33
Exit Target Criteria- $32
Stop Loss Criteria- $25.73
You can check detailed analysis on PHI in the trading room/ Executive summary link here-
www.screencast.com (Available to subscribers)
Time Span- 59:00"
Trade Status: Pending

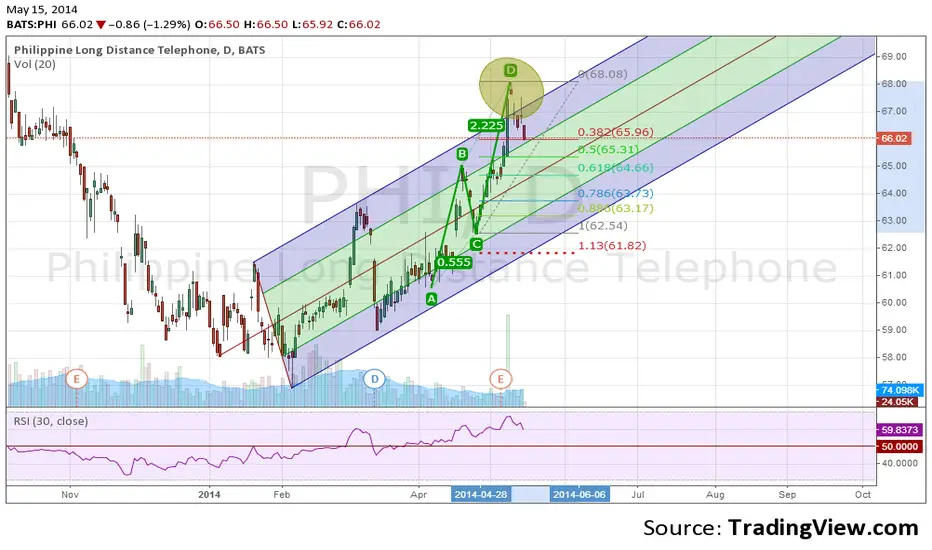
PHI completed a Bearish ABCD Harmonic Pattern.Technical View
Daily Chart
> PHI completed a Bearish ABCD Harmonic Pattern.
> False Breakout from Upper Median Line of Andrew's Pitchfork.
> Support at 50% Fibonacci Retracement Level. Further support is seen at 61.8% Fibonacci Retracement Level and Median Line of Andrew's Pitchfork.
> RSI is currently at 59.83 (Based on 30-Day Period). Support at 50.
fibonaccitrader618.blogspot.com