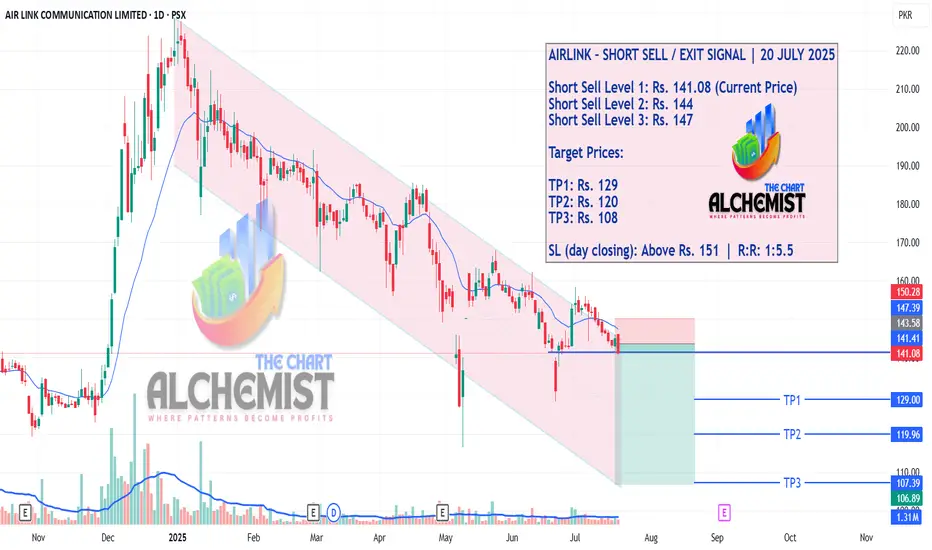
AIRLINK – SHORT SELL / EXIT SIGNAL | 20 JULY 2025AIRLINK – SHORT SELL / EXIT SIGNAL | 20 JULY 2025
AIRLINK has been trading inside a defined downward bearish channel, shaded in light pink. The stock recently tested the 20 EMA and failed to sustain higher levels, indicating that it may now begin a fresh downward leg. This setup presents a high-probability short sell or exit opportunity with clearly mapped downside targets.
AIRLINK trade ideas
AIRLINK DTFIf the marked Grey zone breaks, then next possible supports price levels can be 135-137, 125-129 and 120. Grey zone slightly breached as has been witnessed previously BUT 137-138 is a MUST level to sustain in my view.

Play on Levels.AIRLINK Closed at 152.83 (03-07-2025)
Immediate Resistance is around 156 - 159
Crossing & Sustaining this level may lead
it towards 175 - 177 & then may be towards
200+
Support seems to be around 145 - 146 & then
around 134 - 135.
This time it should not break 128.

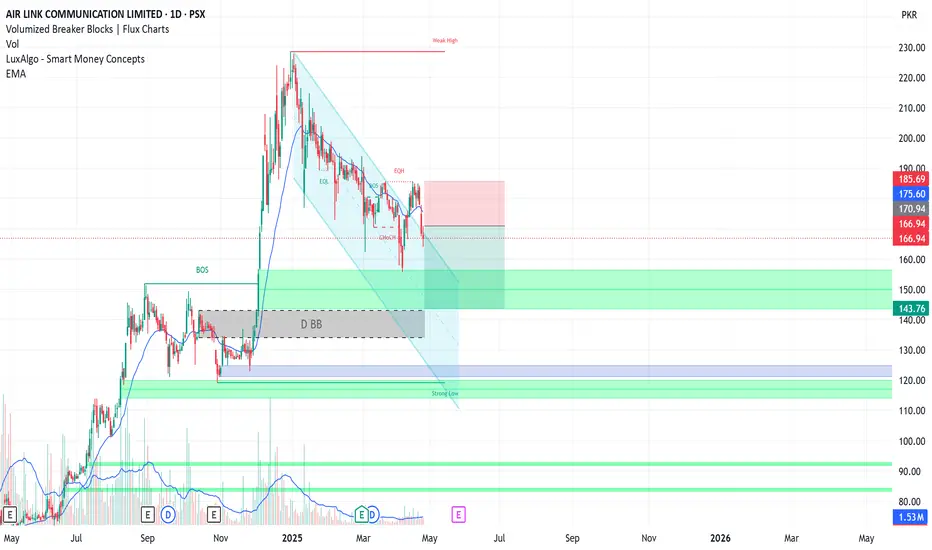
SHORT SELL AIRLINKAIRLINK is in Downtrend since January 2025.
It has recently tried to Breakout of the downward channel but failed to post a higher high
It has created a double top instead
Short Airlink 166-177
TP1 156
TP2 143
SL 186
Live Buying Signal in Airlink This is live Khareedo (Buy) signal in Airlink at 168.99, Lets see how long it will go.
Note: This is not a buy/sell call, Trade at your own analysis and will. Use stop loss too.

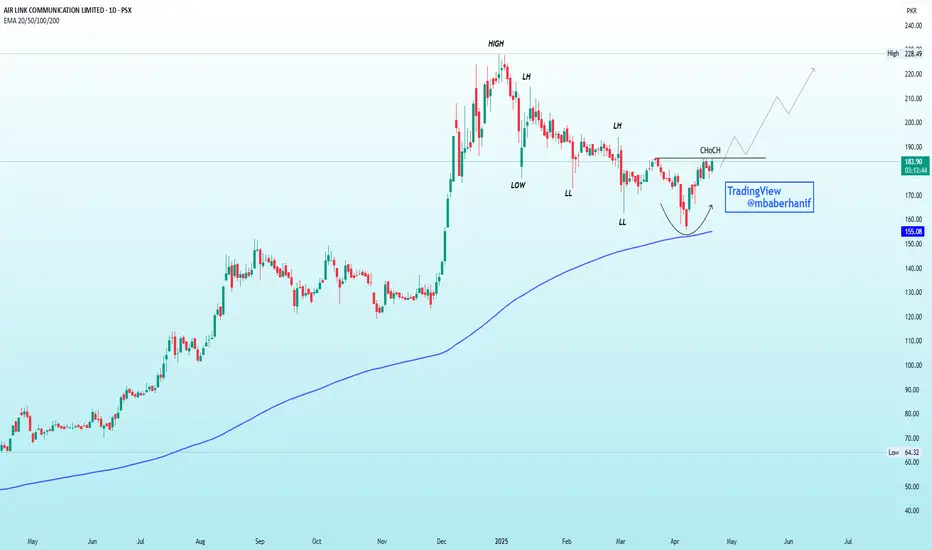
AIRLINK | An Imminent Reversal!!!Previous Trend: Bearish, confirmed by Lower Highs (LH) and Lower Lows (LL).
CHoCH (Change of Character): Bullish signal—price broke previous LH.
Pattern: Rounded bottom forming near the 200 EMA (~155), acting as strong support.
Volume: Slight pickup near bottom—early sign of accumulation.
Outlook: Bullish reversal likely. Break above CHoCH with volume confirms uptrend.
Play on Levels169 - 175 can be a Good Support Area.
Better Financial Results.
Should not Break 161 even in Worst Cases.
Crossing 187 may lead it towards 200 - 203.

Good Financial Results.169 - 175 can be a Good Support Area.
Better Financial Results.
Should not Break 162 even in Worst Cases.
Crossing 180 may lead it towards 190 - 193.

Perfect ABCD Pattern on Weekly TF.Perfect ABCD Pattern on Weekly TF.
161 - 165 is a Good Support now.
Next Important Support level is around 143 - 145.
Company Directors' are themselves buying this
share @ around 171.

Airlink Technical Analysis: Potential Bullish SetupAirlink is moving in an uptrend, holding above a trendline, and is currently testing the 0.5 Fibonacci retracement level, a common area of support where buyers often step in. Price is also testing the 89-day EMA, a Fibonacci number that has historically acted as support, reinforcing the bullish outlook. Airlink is also a fundamentally strong company.
Trading Recommendations:
Buy 1 (CMP): 178
Buy 2: 166
Stop-Loss (Conservative): Closing below 118 (below the most recent higher low)
Stop-Loss (Aggressive): Closing below 140 (horizontal support level & below trendline)
Take Profit 1: 226
Take Profit 2: 268
Take Profit 3: Open
Happy trading!

Currently at ResistanceCurrently at Immediate Resistance.
Should not break 175.
208 - 210 can be witness if 198 - 199 is
Crossed & Sustained.
Bull run will resume once 228 - 230 is Crossed
with Good volumes.

AIRLINK is in consolidation phaseAIRLINK is a very strong scrips for trading and investing, price is 6 percent down good choice for traders buying is good at current price.

AIRLINK offers 40% gain in till the final projectionThe stock has comfortably consolidated and has broken its last LH @ 149.5, crossing that will trigger the potential capital upside of 40%.
There is a bullish flag pattern being posted by the stock and further confirmed when the bullish flag pole is crossed around 152 level.
Instant entry can be made here with the first TP of 179.8 and second TP of 210. Final projections of the bullish flag is 220

AIRLINK - PSX - Technical AnalysisThe SCRIPT has recovered from the impact of the share selling by its Director and now showing bullish trend.
RSI is indicating bulls control after retrace. KVO also suggests Buyers in control taking prices up.
AB=CD pattern has been drawn to identify the TP.
Trade Values
Buy-1: 177.69 (If dips)
Buy-2: 210 (on crossing previous HH)
Buy-3 (Mkt): 192 (risky as it may retrace to test again Fib 0.38 or even Fib 0.50)
TP: 262
SL : 150

Our TP Hit & later it Lower Locked :-Da Shooting Star Formation is actually a Negative Sign
for a Stock.
If anyone is thinking to Enter, should wait for a Proper
Support level.
Immediate Support seems to be around 174 -175
& then around 164 - 165.
One plus point is that there is No Bearish Divergence
so far onn Daily TF so it may give a bounce from
the mentioned Support levels.

Airlink LongCurrently in a consolidation phase wait for break out and than you can enter. I hae not given any targets. You can do your work, and it will be great learning. I think it has the potential to give massive gains.

AIRLINK | Bullish Pennant PatternAIRLINK printed a bullish pennant pattern with no sign of divergence. A bullish trend continuation is expected, entry is suggested at 130-134 with the stop loss below previous lower high level at 113. Previous top of 151.83 considered as TP1 and after the break out it can leads towards the completion of pennant pattern, the price can projected towards 90.

Airlink: PSX Buy CallAirlink was in bullish trend and making HH and HLs. in last 77 sessions, it is moving in a consolidation box. Today it gave breakout of the consolidation box/Bullish flag formation with huge volume which show strength of Bulls. it is expected that price may go high and will touch TP-1 at 1:1 risk to reward. One may target TP-2 i.e. projection of bullish flag.

PSX : AIRLINK AB=CD PatternAIRLINK : The ABCD pattern shows a breakout above the previous high (point B) with significant volume , indicating a potential move upward towards point D. Stop loss is defined at point C.

AIRLINK bullish flag patternAIRLINK formed bullish flag pattern and now submitted breakout on daily charts, Good opportunity for buying at current levels.

AIRLINK | Bullish Flag Pattern PossibilityGiven the current technical setup, buying is recommended at 118, which is a strong support level and also near the lower boundary of the descending channel. This entry point provides an attractive opportunity for a potential upside move, especially if the price starts reversing from this level.
Trade Setup:
Entry Point : 118
Stop Loss : 93 (below the recent support level to limit downside risk)
Target : 168 (potential breakout target from the descending channel)
This setup offers a favorable risk-reward ratio as it aims to capture a reversal from the support level while managing risk effectively with a well-defined stop-loss.

Airlink breakout level for 151 and 176 levelsAirlink is struggling to move upward direction, it was dropped to 118 level and recover to 134 level and again dropped to 124 level.
134.16 is strong resistance level for breakout to heading to 151 and 176 levels.

Airlink Buying and Selling ZoneThese are buying and selling zones of Airlink
Note: Trade at your own risk.
