ATRL buying strategyKey Buying Zone:
📍 Buy between PKR 696 – 680
Stop Loss:
🚫 Place stop loss at PKR 670
Targets:
🎯 Target 1: PKR 710
🎯 Target 2: PKR 749
Extended Strategy:
🔒 If price sustains above PKR 750, hold the position and apply a trailing stop loss to protect profits.
ATRL trade ideas

No bearish divergence yet.ATRL Closed at 676.21 (04-07-2025)
Immediate Resistance around 710.
Crossing this level may lead it towards 770 - 775.
No bearish divergence yet.

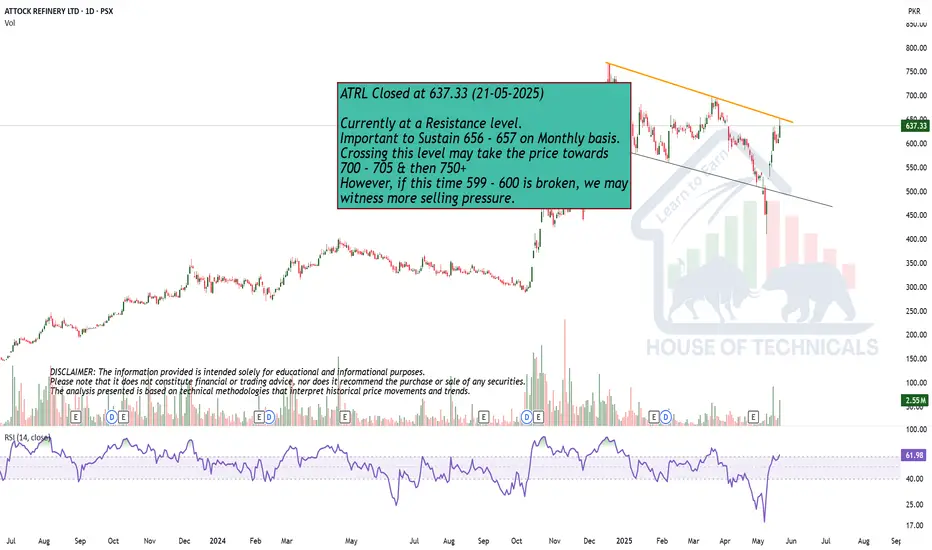
Currently at a Resistance level.ATRL Closed at 637.33 (21-05-2025)
Currently at a Resistance level.
Important to Sustain 656 - 657 on Monthly basis.
Crossing this level may take the price towards
700 - 705 & then 750+
However, if this time 599 - 600 is broken, we may
witness more selling pressure.
Monthly Support.Important to Sustain 529 on Monthly basis.
It may hit 472 - 475 in worst case scenario.
The Bullish divergence on shorter tf may
move the price up towards 550 - 555.

Bullish on Monthly TF.Bullish on Monthly TF.
Though HL Confirmed on Bigger TF but Important
to Cross & Sustain 730 & if this level is Crossed with
Good Volumes, we may witness 770 - 775 initially.
On the flip side, 640 - 645 may act as Immediate
Support.
It should not break 608, otherwise we may witness
more Selling Pressure towards 550 - 570.

No Bearish Divergence Yet!Bullish on Monthly TF.
Though HL Confirmed on Bigger TF but Important
to Cross & Sustain 730 & if this level is Crossed with
Good Volumes, we may witness 770 - 775 initially.
On the flip side, 640 - 645 may act as Immediate
Support.
It should not break 608, otherwise we may witness
more Selling Pressure towards 550 - 570.

Bullish on Bigger TFImmediate Support is around 605 - 610
else, around 590 - 591
2 Possibilities:
1. If reverses from the current level, it may
touch 690 - 730 range.
2. If it does not sustain 590, it should come
down towards 570 ~ 555 range.
Weekly Support 558 should not break as this is
also the HL.

ATRL*ATRL Analysis
*AB=CD Pattern formed in daily time frame
*660 Important Resistance if break then will go up
*Till Now no any Negative sign formed

ATRL - Attock Refinery Ltd. 1DBased on my analysis, ATRL is showing weakness and approaching crucial support levels.
- The descending triangle pattern suggests potential bearish continuation.
-it could be take support from 550 to 520 zoon looking partial buying in that area
This is my personal view and not financial advice. Trade accordingly.


660 - 665 is a Strong Resistance for now.660 - 665 is a Strong Resistance for now.
Monthly Closing above 660 is Required with
Good Volumes for its Further Upside move.
If this level is Sustained, we may witness 750 - 770
& then ABCD Pattern will be in play if 775 is
Crossed & Sustained with Good Volumes, targeting
around 1000+
On the flip side, 590 is an Important Level that
should not break on Monthly basis.


ATRL for 22% quick gainATRL should be considered to trade. Buying can be made around 776 for first TP of 863 and 2nd TP of 950.
This will be quick gain of 22% with SL of 689

ATRL 1D PSX MAKE AB=CDATRL MAKE ABCD HARMONIC PATREN. It's potential reversal zone at 540 to 550
SL=428
TP=545

ATRL - Technical Analysis - Buy Call for Long-term HoldingOn Daily TF, price has already made its all time high and as such there is no sign of reversal. RSI shows no divergence and Klinger also suggests continuation of sharp uptrend.
With good news surfacing wrt refineries, share prices are likely to go up sharply.
Therefore, it is strongly recommended to initiate Buying immediately. Fib Extension tool has been used to identify potential first profit booking area marked as TPs. This Bull run is expected to run till end Sep~Dec, 2026 ; therefore, long term holding may also be considered.
Trade Values
Buy : 493 , SL: 420 , TP 1: 644, TP 2: 862 , TP 3: 1080 , TP 4: 1213

At Good Support Level?422 - 425 may also act as an Immediate Support.
However, a Very Important Support lies around
412 - 415.
However, if this level is broken, we may witness
382 - 387.
Sustaining 427 - 428 may lead it towards 500.
And Crossing & Sustaining 510 may expose range around 650.

Stock is Still Bullish.Stock is Still Bullish.
Immediate Support is around 425 - 426
However, it may re-test 414 - 415 which is
actually a very Important Support level.
If it sustains 490 - 500, we may witness 600.

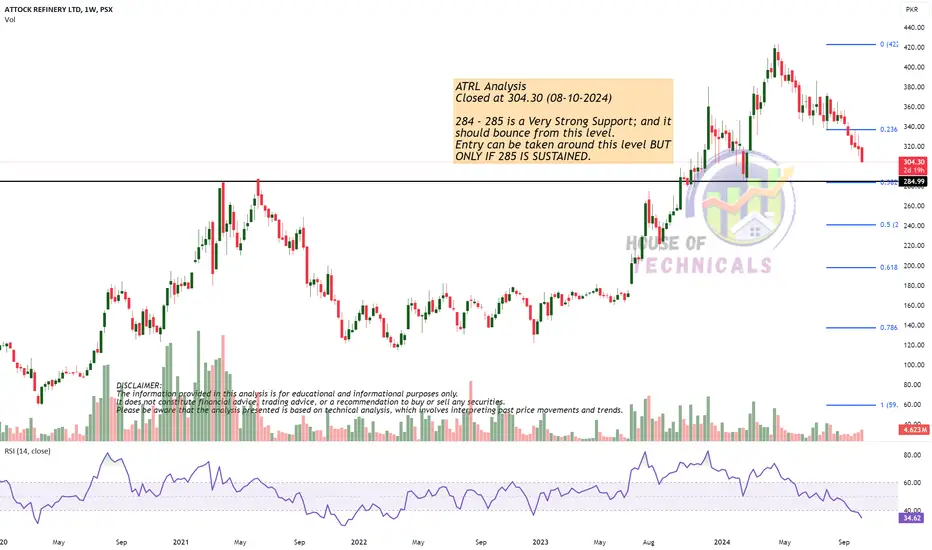
X Dividend..284 - 285 is a Very Strong Support; and it
should bounce from this level.
Entry can be taken around this level BUT
ONLY IF 285 IS SUSTAINED.
ATRL - Reversalis currently in a bearish trend , made its double bottom, reversal expected near xdividend date, intraday entry is recommended from this point.

ATRL is BullishATRL seems to be gearing up for another bullish move, as bullish RSI divergence has emerged and matured at daily time frame, indicating the strong hold of bulls on the price action. If previous lower high is broken and a higher high is printed, we can expect a bullish rally as per Dow theory. Targets are mentioned on the chart.

ATRLBullish after creating flag pattern on weekly time frame
Already touch the 2017 highs
if break last high of 2017, it can make new highs

ATRL 1D IN PSX MAKE BULLISH DIVERGENCECertainly! Here's a description for **Attock Refinery Limited (ATRL)**:
Attock Refinery Limited (ATRL) has formed a bullish divergence on the 1-day chart, indicating potential upward momentum. The recommended **entry level** is at the current price, with a **stop loss** set at 340 to manage risk. The **take profit** targets are 388 and 413, suggesting a favorable risk-reward ratio. 📈💼
Happy trading! 🚀💰

ATRL:- BULL SHALL TAKE THE GAME TO NEXT LEVEL.ATRL has been in tremendous bull run which started last year.
From May 2024 to onward the security was forming a triangle, which denotes the continuation of the bull trend.
The triangle has successfully breached and price is coming back to test its support. bullish divergence has already been formed on RSI, thus forming the confluence in favor of bulls.
SL, in this scenario shall be 330 and TP is 450. Whereas the long position may be opened at current market price.
Due diligence and strict money management is solicited.
Have a profitable trading.
