AVN, Bullish Channel with Flag Breakout- Weekly Bullish Flag
- Breakout of flag
- Now trading in Bullish Channel
- Time cycle indicated
- A complete cycle takes around 220 days
- This cycle completed around 200 days
- New cycle and bullish moment is expected in next 20-30 days
- upcoming board meeting may trigger this cycle
- Buy suggested with SL of closing below 48
- Take profit on top of channel
- Ultimate target is 140
AVN trade ideas

AVN potential Buy setup (Weekly)Reasons for bullish bias:
- Price bounced from ascending channel support
- Price respecting long-term upward trendline
- Strong weekly closing at support
- RSI is synched
Here are the recommended trading levels:
Buy 1(CMP): 54.55
Buy 2: 43
Stop Loss Level: 36
Take Profit Level 1: 69
Take Profit Level 2: Open

AVN-PSXUsing pure price-volume analysis with a Renko chart, you can identify different support and resistance levels. By using a volume indicator, you can determine the most traded price level, which represents the accumulation zone—around 55.74. The price range between 54.12 and 56.90 is also an accumulation zone. Adjust your strategy accordingly by taking profit or accumulating more, based on your level.

AVN- intarday callis currently in a bearish trend , possibility of reversal from this zone
intraday entry is recommended

...but that needs a ConfirmationImportant Support seems to be around 46 - 47.
However, Immediate Support can be around 52 - 53
but that needs a Confirmation.
Immediate Resistance is around 62 - 62.50

Avanceon buy IDEAIf AVN holds its long term resistance turned into support and keeps moving in the same parallel channel 70 and 80 could be the next targets

AVN - Look & LeapLarger Trend: Bullish
Smaller Trend: Bearish
Buy Scenerio:
1. Price reaches to buy zone, put stoploss at below of buy zone and tp must be at mid range.

Bullish on Weekly TF.
Initial Support lies around 64 - 64.50 & then around 61.
Immediate Resistance lies around 66 and then around 69.
However, important to Sustain 66 - 67 on Monthly basis.
In worst case, it may touch 57 - 59 area.

AVN - Break of horizontal resistance on daily.AVN was in downtrend, it had broken its trendline previously. Recently it has broken its horizontal resistance, we are anticipating a long move in AVN, stoploss is placed to manage the risk effectively.

AVN | Pennant Pattern OR Double Top?The AVN stock price currently exhibits a Pennant pattern with a confirmed breakout, indicating a bullish momentum in its price action. Presently, the resistance level stands at 63.20, potentially forming a double top pattern. Upon completion of this pattern, the projected target for the Pennant pattern is approximately 70.


AVN (LONG) ANALYSIS 2.0pateeince do same
ChatGPT
🚀 Trade Alert: AVN Bullish Trend & Horizontal Support 🚀
We have identified a bullish setup in AVN, highlighted by the following observations:
Bullish Trend: AVN is in a confirmed bullish trend.
Sideways Movement: Currently in a sideways consolidation phase.
Bearish Divergence: Previously present but now dissolved.
Support Line: The price is at a horizontal support line.
RSI: Supporting a bullish flag pattern, indicating potential upward movement.
Entry Point:
Buy: At the current market price (CMP) near the horizontal support line
Target Prices (TP):
TP 1: 📈
TP 2: 📈
Longer Ride: Must surpass point D with good volumes for a rally towards 76.00
Stop Loss (SL):
SL: Below the horizontal support line to manage risk
Trade Summary:
Buy: At CMP near horizontal support line
TP 1:
TP 2:
Longer Ride: Surpass point D with good volumes for a rally at 76.00
SL: Below horizontal support line
Technical Indicators:
RSI: Supporting the bullish flag pattern
Patience: Targets will be triggered soon, stay patient
Trade Type: Long Swing 🎢
Good Luck! 🍀
Stay informed and trade smart! 📊


AVNLooking at the chart, we observe the formation of a symmetrical triangle pattern. The converging trendlines suggest a period of indecision in the market. As breakout is observed, we could see a bullish continuation with a potential target based of 68 on the triangle's height. Conversely, a downside breakout might indicate a bearish move (stop loss: 50), and traders should be cautious, considering the support level as a key point to watch."

AVN=====Bearish Trend Before Bullish Making Higher high and higher low hen came to Resistance gets Rejection of Prices Show with Divergence in RSI and Volume Now Trend is Change Making Bearish Flag Breakout of This Flag Gets more chances to Trend continue to Bearish

AVN | Flag PatternAVN is currently within a Bull Flag pattern, facing resistance around 53. Multiple barriers hinder breakout. Anticipation for bullish reversal towards 56-59 post-breakout; breach below 49 signals potential bearish momentum.

AVN (Intraday/Short Swing)AVN is in a bullish trend. 2 hourly channel tops. Consolidating to go for further targets at 63 after crossing 66 is our next target.
Sell AVN from 63-66.
Buy AVN from 59-61.
SL At 57.

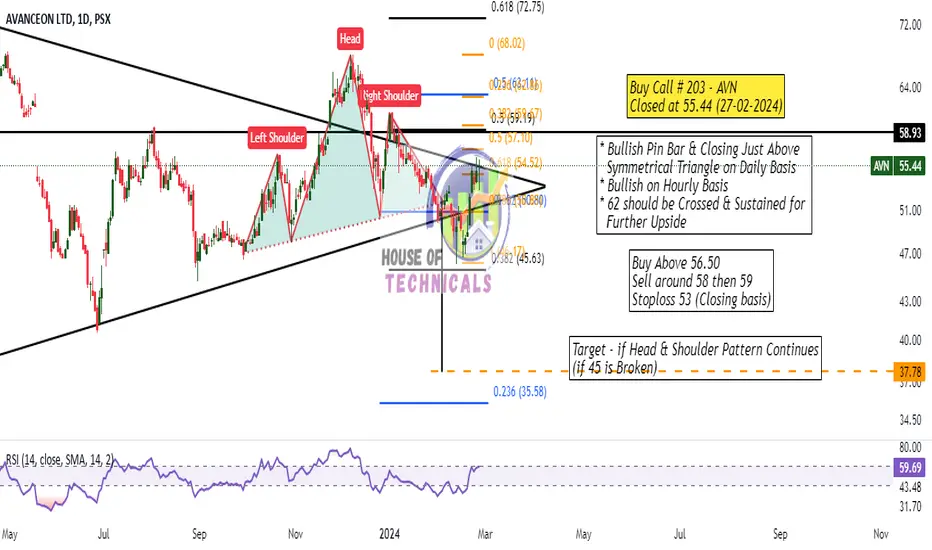
Test Case - Bullish Divergence will Play or H&S Pattern?Bullish Divergence on Daily TF
H&S Pattern yet to complete its Right Shoulder

Bullish Pin Bar* Bullish Pin Bar & Closing Just Above
Symmetrical Triangle on Daily Basis
* Bullish on Hourly Basis
* 62 should be Crossed & Sustained for
Further Upside
AVN is BullishAVN has finally given a breakout from the declining phase, and is currently breaking the previous lower high. After the formation of a higher high, a bullish rally is expected to be triggered from here. Targets are mentioned on the chart.

ABCD Patterns in play!Bullish Divergence on Daily TF
Also ABCD pattern is completed around 46
However, another ABCD Pattern is in play and
we may witness 43 - 44

AVN bull run continuesAVN broke the long continued bull run as seen in the charts.
Onto its next support

AVN is in major wave [5] since 2023𝐋𝐨𝐧𝐠-𝐭𝐞𝐫𝐦 𝐚𝐧𝐚𝐥𝐲𝐬𝐢𝐬 𝐉𝐚𝐧-𝟐𝟕 (Weekly TF)
𝐒𝐜𝐫𝐢𝐩𝐭: Avancoen (𝑨𝑽𝑵)
Considering the price action, and price 40.5 as the bottom of larger wave and start of wave , there are two major scenarios for a 𝑙𝑒𝑎𝑑𝑖𝑛𝑔 𝑑𝑖𝑎𝑔𝑜𝑛𝑎𝑙 𝑤𝑎𝑣𝑒.
𝐀 - 𝐋𝐞𝐚𝐝𝐢𝐧𝐠 𝐝𝐢𝐚𝐠𝐨𝐧𝐚𝐥 𝐬𝐜𝐞𝐧𝐚𝐫𝐢𝐨 𝟏: (𝐁𝐥𝐚𝐜𝐤 𝐥𝐢𝐧𝐞𝐬)
1- The wave movement does not seems to be
impulsive, rather more looks like diagonal since
wave 3 in wave (1) of major wave is only 1:1
which is characteristic of non-impulsive wave 3.
2- Secondly the 𝑟𝑒𝑡𝑟𝑎𝑐𝑒𝑚𝑒𝑛𝑡 𝑜𝑓 𝑤𝑎𝑣𝑒 4 trespassing
61.8% also indicates diagonal characteristic.
3- In a diagonal case the wave 4 can retrace beyond the border of wave 1 top and can extend down to 88% (~47 price).
4- In diagonals 𝑤𝑎𝑣𝑒 5 𝑚𝑎𝑦 𝑛𝑜𝑡 𝑏𝑒 𝑒𝑥𝑡𝑒𝑛𝑑𝑒𝑑,
hence the 𝑝𝑜𝑠𝑠𝑖𝑏𝑙𝑒 𝑡𝑎𝑟𝑔𝑒𝑡𝑠 𝑓𝑜𝑟 𝑤𝑎𝑣𝑒 5 could be
61.8% or 78.6% i.e. (69.35 𝑜𝑟 75.65, 𝑟𝑒𝑠𝑝𝑒𝑐𝑡𝑖𝑣𝑒𝑙𝑦).
𝐁- 𝐋𝐞𝐚𝐝𝐢𝐧𝐠 𝐝𝐢𝐚𝐠𝐨𝐧𝐚𝐥 𝐬𝐜𝐞𝐧𝐚𝐫𝐢𝐨 𝟐: (𝐑𝐞𝐝 𝐥𝐢𝐧𝐞𝐬)
1- Since the length of 𝑡ℎ𝑖𝑟𝑑 𝑖𝑚𝑝𝑢𝑙𝑠𝑒 𝑤𝑎𝑣𝑒 is only 1:1 which is characteristic of 𝑤𝑎𝑣𝑒 𝐶,
therefore the possibility of wave 3 in wave (1) of wave can be ignored.
2- The possibility of wave C formation can also be supported if the current corrective wave can
retrace 𝑏𝑒𝑦𝑜𝑛𝑑 61.8% 𝑐𝑜𝑟𝑟𝑒𝑐𝑡𝑖𝑜𝑛 𝑠𝑢𝑏𝑠𝑡𝑎𝑛𝑡𝑖𝑎𝑙𝑙𝑦.
3- In this scenario the top of wave C is considered as wave 1 top of wave (1) of wave .
4- the correction will be of wave 2, and 𝑤𝑎𝑣𝑒 2 has the chances 𝑡𝑜 𝑟𝑒𝑡𝑟𝑎𝑐𝑒 𝑎𝑠 𝑚𝑢𝑐ℎ 𝑎𝑠 88.2%).
5- Thus the downtrend bottom value could be 𝑏𝑒𝑡𝑤𝑒𝑒𝑛 41-43.
𝐂𝐨𝐧𝐜𝐥𝐮𝐬𝐢𝐨𝐧𝐬:
The price action suggests that the 𝑑𝑜𝑤𝑛𝑡𝑟𝑒𝑛𝑑 𝑚𝑜𝑣𝑒𝑚𝑒𝑛𝑡 𝑖𝑠 𝑠𝑡𝑖𝑙𝑙 𝑜𝑛𝑔𝑜𝑖𝑛𝑔 and the 𝑠𝑐𝑒𝑛𝑎𝑟𝑖𝑜 𝐵 𝑙𝑜𝑜𝑘𝑠 𝑚𝑜𝑟𝑒 𝑝𝑟𝑜𝑏𝑎𝑏𝑙𝑒, which means that we can see a retracement all the way down to 47-49 𝒊𝒏 𝒄𝒐𝒎𝒊𝒏𝒈 𝒘𝒆𝒆𝒌𝒔.
This also suggests that 𝐀𝐕𝐍 may be 𝐧𝐨𝐭 𝐚 𝐠𝐨𝐨𝐝 𝐜𝐡𝐨𝐢𝐜𝐞 𝐟𝐨𝐫 𝐢𝐦𝐩𝐮𝐥𝐬𝐢𝐯𝐞 𝐭𝐫𝐚𝐝𝐢𝐧𝐠 but could be a 𝑠𝑢𝑖𝑡𝑎𝑏𝑙𝑒 𝑐𝑎𝑛𝑑𝑖𝑑𝑎𝑡𝑒 𝑓𝑜𝑟 𝑐ℎ𝑎𝑛𝑛𝑒𝑙 𝑏𝑜𝑢𝑛𝑑 𝑠𝑖𝑑𝑒𝑤𝑎𝑦𝑠 𝑡𝑟𝑎𝑑𝑖𝑛𝑔.
𝐍𝐨𝐭𝐞: 𝑴𝒐𝒗𝒊𝒏𝒈 𝒃𝒆𝒍𝒐𝒘 40.6 𝒊𝒏𝒗𝒂𝒍𝒊𝒅𝒂𝒕𝒆 𝒕𝒉𝒆 𝒘𝒉𝒐𝒍𝒆 𝒔𝒄𝒆𝒏𝒂𝒓𝒊𝒐 (𝑩𝒐𝒕𝒉 𝑨 𝒂𝒏𝒅 𝑩).
