CNERGY SHORT TRADECNERGY has recently broken down of its upward trend line after encountering Bearish Breaker Block
It is expected to continue its new downtrend
Short CNERGY 7.8-8.1
TP 6.8
SL 8.9
CNERGY trade ideas


CNERGY | Rising Wedge & Bearish Divergence!Two sign of danger
Rising Wedge Pattern and Bearish Divergence with Volume indicator
Rising Wedge Pattern:
Characteristics: Converging trend lines with higher highs and higher lows, narrowing range.
Interpretation: Bearish reversal pattern, weakening buying pressure.
Trading Strategy: Short selling after break below lower trend line, set stop-loss above upper trend line.
Confirmation: Decreasing volume and other indicators like RSI or MACD can add to bearish implications.
Bearish Divergence with Volume:
When you see a price increase accompanied by decreasing volume in technical charts, it's often considered a bearish sign.
Weakening upward momentum: Decreasing volume during a price increase can indicate that the upward momentum is losing steam. This could be due to a lack of buyers or interest in the stock at current prices.
Potential reversal: A price increase on low volume might suggest that the trend is about to reverse. If there's not enough buying pressure to sustain the price increase, sellers might step in, causing prices to drop.
False breakout: Decreasing volume during a price increase can also indicate a false breakout. If the price breaks out above a resistance level on low volume, it might not be a genuine breakout, and prices could fall back below the resistance level.

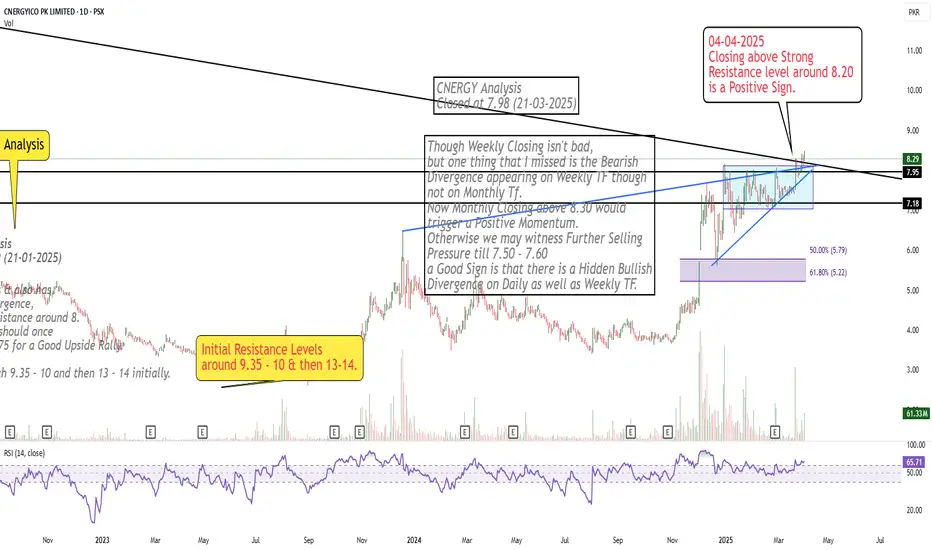
Crossed Important Resistance Area
Closing above Strong
Resistance level around 8.20
is a Positive Sign.
PSX- CNERGY : Breakout or Rejection? Trading Strategysignificant increase in volume is observed indicates accumulation by institutions or major market participants.
While Net volume remains negative (-8.06M), suggesting some selling pressure at higher levels.
Trading Strategy:
Short-Term Strategy
Buy on pullback when price retraces to 7.0 - 7.2 PKR, its a better risk-reward entry for Profit target: 8.7 - 9.0 PKR
Keeps Eyes on bearish divergence in volume —if price rises but volume declines, a correction may follow.

CNERGYTrend is Bulish. with Bulish Ascending triangle beark.
Trade Plan
Buy : 7.98
Stop Loss :5.50
TP: 10.54
RRR 1:1

CNERGY in a Bullish Flag PatternCnergy is moving and forming bullish flag pattern. Can go for Buy=7.58 or on breach of the flag with a SL =6.9 and TP =12

BYCO-Bullish Flag PatternByco is moving and forming bullish flag pattern. Can go for Buy=7.58 or on breach of the flag with a SL =6.9 and TP =12

CNERGY - Daily - Technical AnalysisCNERGY has been in the consolidation for quite some times and it may continue to play in that zone. Technically very correct Buying (Buy-2) is recommended once price breaks the resistance zone.
However, price has been following ascending parallel channel as well, and at the moment it is close to the support line. Therefore, it may continue to go up. However, if this line is breached than price may slip to further lower values. Therefore, for day trading at CMP (BUY-1), a tight SL is recommended.
RSI indicator is also moving slowly upwards and Klinger is also laying low close to zero. Therefore, these are in a neutral zones hinting at the reluctance of traders in this SCRIPT.
Trade Values
Buy-1 (CMP) : 7.58
TP-1: 7.90
SL-1: 7.08
Buy-2: 8.20 (Technically better)
TP-2: 11.00
SL-2: 7.95

Though Bullish on All Time Frames but..Though Bullish on All Time Frames & also has
a Very Strong Monthly Bullish Divergence,
But Currently at a Very Strong Resistance around 8.
Either it should Sustain 8.15 or it should once
retrace upto the range of 6.35 -5.75 for a Good Upside Rally.
Upside it has the potential to touch 9.35 - 10 and then 13 - 14 initially.
However, it should not break 3.5.

CNERGY - PSX- Buy OpportunityCNERGY is making HHs and HLs after breaking a long accumulation; right now, it is at a strong support level. Look to buy at the current level and place stop loss below the previous HL.

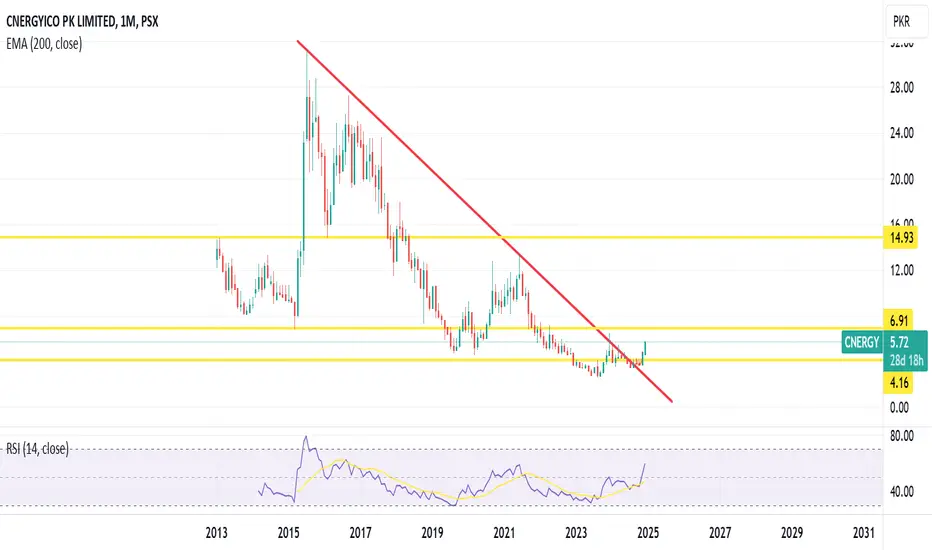
CNERGY LOOKS BULLISH ON LONG TERMCNERGY LOOKS BULLISH ON LONG TERM
CNERGY has been moving in corrective pattern on the long time analysis, since inception. However after bottoming in 2023, it seems impulsive on the short to midterm path.
Considering original corrective pattern, it should hit Target 1 on mid term level and can go as up as 55 in the long run.
Considering impulsive move on the long run these targets can be much much higher.
DISCLAIMER:
The information provided doesn't guarantee results. 𝙏𝙧𝙖𝙙𝙞𝙣𝙜 𝙞𝙣 𝙛𝙞𝙣𝙖𝙣𝙘𝙞𝙖𝙡 𝙢𝙖𝙧𝙠𝙚𝙩𝙨 𝙘𝙖𝙧𝙧𝙞𝙚𝙨 𝙧𝙞𝙨𝙠𝙨. Individuals should perform a thorough analysis and consider their risk tolerance before making investment decisions. 𝙄 𝙖𝙢 𝙣𝙤𝙩 𝙧𝙚𝙨𝙥𝙤𝙣𝙨𝙞𝙗𝙡𝙚 𝙛𝙤𝙧 𝙛𝙞𝙣𝙖𝙣𝙘𝙞𝙖𝙡 𝙡𝙤𝙨𝙨𝙚𝙨 𝙧𝙚𝙨𝙪𝙡𝙩𝙞𝙣𝙜 𝙛𝙧𝙤𝙢 𝙖𝙘𝙩𝙞𝙤𝙣𝙨 𝙗𝙖𝙨𝙚𝙙 𝙤𝙣 𝙩𝙝𝙞𝙨 𝙥𝙤𝙨𝙩. Consult with a qualified financial advisor before entering to trade in stocks.

CNERGY - Long from Rs 4.5I entered last month and am already in a good profit. Monthly breakout already done.
Immediate targets and long terms highlighted with yellow lines.
CNERGY, Harmonic Gartley, Bullish Move ExpectedHarmonic Gartley Pattern
Expected Reversal
Ascending Triangle Formation
Buy on closing above triangle
Buy above 4.30
Stoploss 3.65
Target 5.42

CNERGY | Daimond PatternCNERGY is currently forming a diamond pattern, which suggests a potential uptrend. A breakout level is identified around 4.30. Should the price sustain above this level, it may advance towards 4.80 and subsequently to 5.38. It is advisable to set a stop loss at 3.75, positioned below the previous swing low.
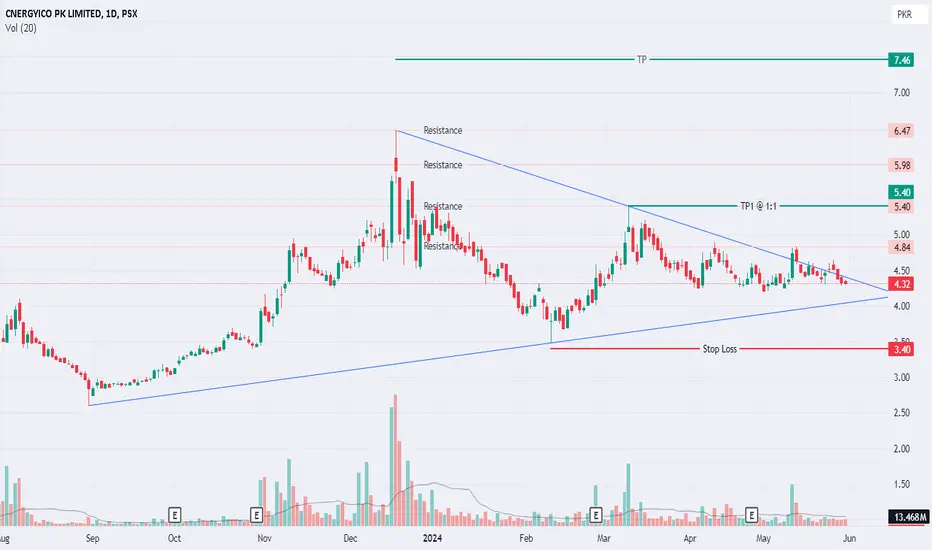
PSX: CNERGY foundation has been laid.From the start of this year the CNERGY has been struggling to sustain it journey to north and has not been successful in its attempts. In all this a triangle has been formed suggesting that it will resume its journey in whichever direction it breaks. Currently the price is breaching the upper trend line creating a bias for upward movement.
SL for the trade is 3.40 & correspondingly the TP is 5.40. Close above 5.40 shall lead to the medium term TP which is 7.48
Wishing you Profitable Trading
CNERGYPrice rejected from resistance level in last trading session. If 3.7 level sustains we expect pull back and this time breaks resistance above 4.10. First and second targets are 5.10 and 5.60 respectively. However, risk is defined below 3.70

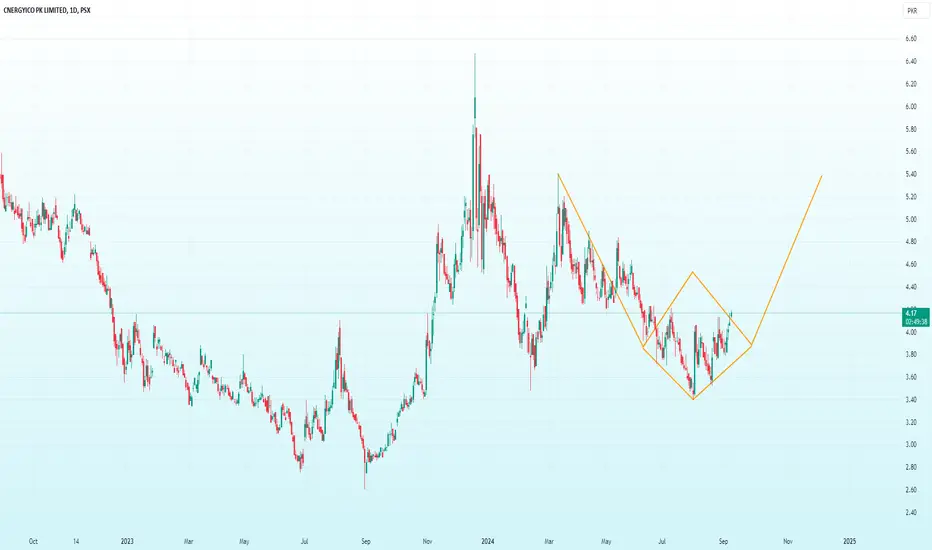
Cnergy Analysis - (2.0) Buy."It looks like Cnergy is on the verge of a bullish reversal and may soon enter an upward trend. The RSI is showing bullish divergence 📈, and there's a bullish reversal pattern forming in the shape of a falling wedge. I recommend placing a buy stop order at 4.60, to be triggered upon the LH and neckline break. Alternatively, you can consider partial buying at current rates near the channel bottom, with confirmation at 4.60. 🚀 Set your stop-loss (SL) at 4.20 and target 5.10 and 5.60 respectively. This strategy blends technical analysis and risk management for a potentially profitable trade. Best of luck with your trading! 🍀🌟"

Cnergy (Analysis).(Long)Technical Analysis: CNERGY (Ticker: CNGY)
Pattern Analysis: CNERGY shows a bullish falling wedge pattern, hinting at a potential reversal.
RSI Analysis: RSI (30-70 range) supports bullish momentum without divergence.
Trade Tip: Consider going long above the neckline at ₹4.61 with a stop-loss at ₹4.27.
Target: A double bottom pattern suggests a target of ₹5.50.
Summary: Bullish outlook with a breakout potential. Entry at ₹4.61, target at RS 5.50. 📈🚀
Disclaimer: Not financial advice; do your own research.

CNERGYWe can attempt to buy CNERGY if it gives breakout of above trendline of symmetrical triangle pattern , target would be 6.3 .
We can attempt to short CNERGY if it gives breakout of below trendline of symmetrical triangle pattern , target would be 2.61 .
Currently We can use wait and see approach and act from specified level.

CNERGYEngaging in trading activities by relying on the analysis of patterns involves the systematic examination of historical price movements and formations in financial markets. Traders who employ this approach typically scrutinize charts and identify recurring patterns, such as triangles, head and shoulders, or candlestick formations, to make informed decisions about when to enter or exit trades. The methodology behind pattern analysis is rooted in the belief that historical price movements often repeat themselves, providing traders with valuable insights into potential future market behavior. By recognizing and interpreting these patterns, traders aim to predict market trends and capitalize on potential opportunities, enhancing their chances of making successful trades. However, it's important to note that pattern analysis is just one of many tools in a trader's toolkit, and its effectiveness is subject to various factors and market conditions.

Downtrend of CNERGY:PSXis expected to be overCNERGY:PSX is presently in downtrend in 1D timeframe. However a bullish divergence on RSI indicates an end of existing trend and a likely bullish reversal. Long entry through buy stop has been marked above previous swing high. SL has been suitably placed below last LH. TP has been set @ 1:1 RRR.

CNERGY - Bearish trend likely to continueformation of descending triangle and no diversion means continuation of the bearish trend.
