CPHL trade ideas

CPHL Analysis-Long Trade13/4/27
TF- 1D
CPHL has recently completed its correction and started a new bullish trend from Rs 82.
Buying at current level is not recommended
Buy after RT of recent BO 88-92
TP1 109
TP2 116
TP3 126
SL 78

#CPHL is above green sky (strong bullish zone )#CPHL is now above green sky (Strong bullish zone). It is expected to cross 110 and 130 level.
Note: This is not a buy or sell call, trade at your own will. Use stop loss as per your strategy.

CPHL Stock Trading Strategy:CPHL has posted a breakout and is currently trading at 98. The strategy is to buy around 98-94, set a stop loss at 90, and target a price of 108.

CPHL Buying setupHere is the corrected text:
"CpHL is currently trading in the buying zone. We can buy:
1. Around 87-83
2. Second buy when price crosses or closes above 93
Stop Loss: 81
Target: 108
Further hold if closes above 108."

CPHL BUYING SETUPHere is the corrected text:
"CpHL is currently trading in the buying zone. We can buy:
1. Around 87-83
2. Second buy when price crosses or closes above 93
Stop Loss: 81
Target: 108
Further hold if closes above 108."

CPHL is showing upward momentumCPHL is in upward trend, currently price has taken good correction and know showing upward signs. Good time to buy at current price.

CPHL is showing upward momentumCPHL is in upward trend, currently price has taken good correction and know showing upward signs.good time to buy at current price.
City Pharma LimitedStrength
1)According to dow theory city pharma limited is following uptrend and never break recent lower high.
2)Creating clean AB:CD pattern on daily and weekly time frame.
3) Completed 50 to 60% retracement on daily and weekly time frame and it looks good for uptrend from current price level.
Weakness
1) Price level of 92 to 93 showing rejection if it sustain above this price then we can expect good uptrend

Recently made LL on Shorter TF, but..Recently made LL on Shorter TF,
but also it is a Support level with Double Bottom.
Hidden Bullish Divergence on Daily TF.
Immediate Support lies around 86 - 89
& Immediate Resistance is around 91 - 92.
Sustaining 91 - 92 on Weekly TF, would
lead it towards 98 - 99.
Ultimate Target (if 109-110) is Sustained,
is around 128 - 130.
Should not break 81 now.

CPHL CPHL Is still playing Dow theory very beautifully . i also mentioned pattern behaviour cycle still up move a head . it is recommended to buy with paramedic strategy for better results


CPHL Analysis Stock Analysis By : Ali Safwan
On : 06 March 2025
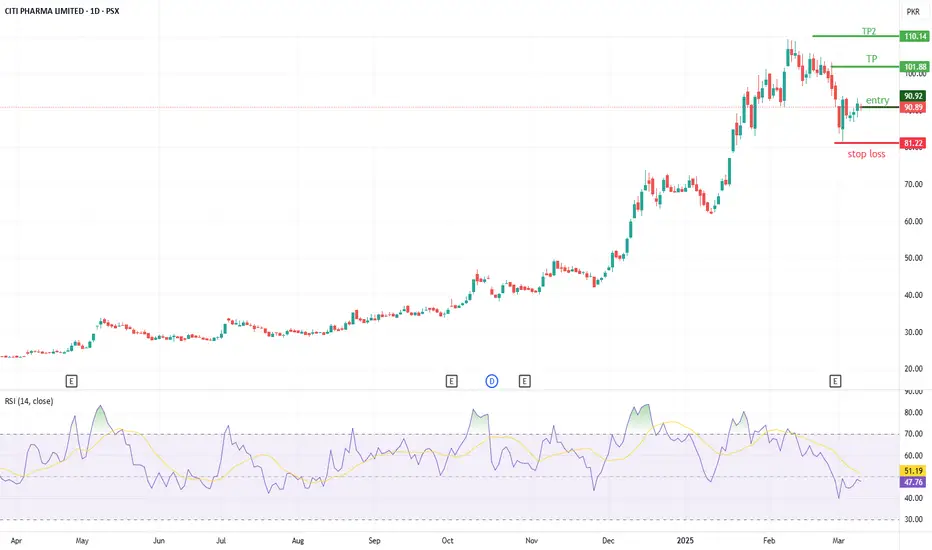
Price Action & Trend
Stock is in a correction phase, with retracement from highs.
Weekly Support Strength trendline is still intact, but the price is testing it.
If price breaks below this trendline, further downside correction can happen.
Consolidation Zone
The gray area (~63.90 - 74.60 PKR) shows past consolidation.
If the price drops further, this area could act as a demand zone.
Volume & Momentum
Volume has declined compared to the earlier rally.
Momentum is weakening, but price is near key support.

CPHILtrendline test and print bulish engulf candle. aslo fib level 0.50%
Trade Plan
Buy 88
target 109

CITI PHARMA-Sideways Trend for 22% & 35% gainShort-Term Outlook: The stock is bearish, as indicated by the RSI, Klinger Oscillator, and price action near support levels.
Potential Entry Points: If the RSI starts climbing above 35-40, and the price holds support at 85.60 or 80.01, it could present a buying opportunity.
Risk Factor: If the price breaks below 80.01, expect further downside towards 72.04 or lower.
Confirmation Needed: Look for increased volume and positive oscillator movement before making bullish trades.
Buy-1: 80
Buy-2: 76
Buy-3: 72

CPHL Breakdown – Bearish Trend Confirmation?CPHL has broken below a key lower high, signaling bearish momentum on the 1H timeframe. With increasing selling pressure and RSI at 24 (oversold), further downside is possible unless buyers step in. If support at holds, a short-term bounce could occur. However, failure to reclaim resistance may lead to further declines. Watching for confirmation before entering a trade.
What’s your outlook? Drop your thoughts below! 📉🔥


CPHL | Trade SetupCPHL is currently in an overbought zone, and profit-taking is advised at higher levels. The price action has surpassed its previous high of 101, reaching a new peak of 109.30. The previous resistance at 101 now serves as a support level, and a long position may be considered once support is firmly established around this level. The next potential target for the upcoming impulse move is approximately 118. To manage risk effectively, a stop-loss should be placed below 92.50. This swing trade setup anticipates a potential gain of 16.83%.

CPHL will be double in value soon. Positive momentum and maintaining
support of 62 today, It is likely to cross 81.25, 100 and 120 levels.
I think it could cross 120 level in
January of February 2025.
Note: this is not a buy/sell call
Use stop loss whenever trade.

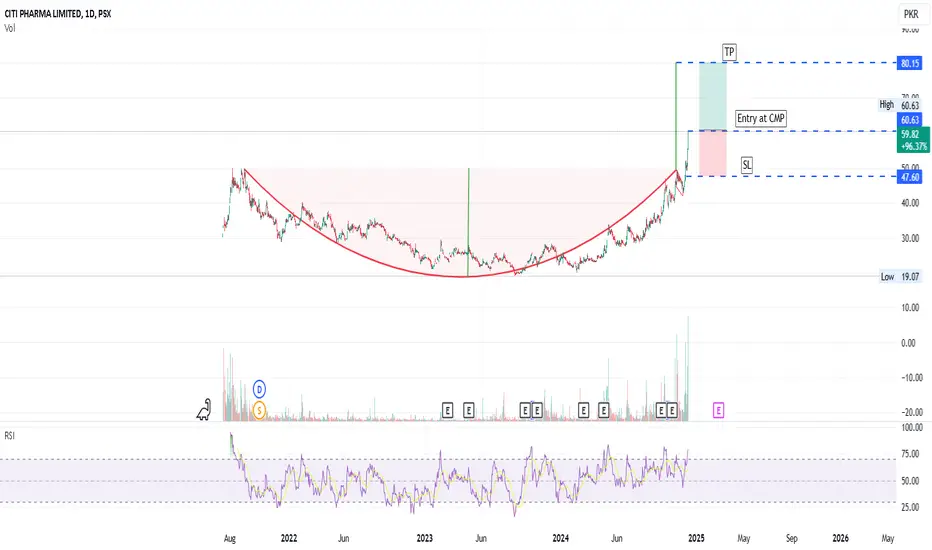
CPHL - PSX - Technical AnalysisCiti Pharma is in bull run for almost past 9 months. On Monthly TF, Cup has been formed but Handle is yet to be made. See picture pasted on the chart. For that price must retrace a bit to Fib 0.23 to 0.38. In that case Entry will be at retrace and TP will be equal to depth of the cup.
On the other hand if price does not retrace then entry should be sufficiently above the Daily Resistance level so that it then becomes its support level.
RSI and KVO both are supporting the bull run continuation.
Trade Values
BUY-1: 53
BUY-2: 42
TP: 81
SL : 38 (HL)

CPHL-Buy CallAfter listing in PSX in 2021, the instrument posted high of around 50. After that it was in bearish trend and touched low of around 19. However, during last three years, the instrument made typical Cup and handle pattern and gave breakout with huge volume. Now it is in bullish trend and making HH and HL. One can make entry at current market price and target cup and handle projection up to 80.
CPHL continuing upward moveCPHL was in correction phase know showing bullish signs on daily char, current levels are good for buying .

CPHL | Cup & Handle PatternCPHL is currently forming a cup and handle pattern, with the cup already completed. The stock is expected to experience a pullback as it forms the handle, with the neckline situated around Rs. 35.67. Initial support for the handle is anticipated in the range of Rs. 31.70 to Rs. 31, where a long position can be considered. A break above the neckline could encounter intermediate resistance around Rs. 40, while the pattern's projection target is approximately Rs. 49.70.
