Bullish Divergence appeared on bigger tf.Bullish Divergence appeared on bigger tf.
Sustaining 33 on monthly basis would be
a positive sign.
36 is the Breakout level.
Immediate targes can be around 43 - 45
If 32 is not sustained on Monthly basis,
we may see further selling pressure towards
25 - 27
EPCL trade ideas

LONG EPCLLonged EPCL. Bought spot shares, no leverage. Resting above monthly support. Entry, Stop Loss and Exit all there. If it claims back above 40, it should be the new support and it should run then imo. Will take a while to play out. Patience is always rewarded. Worth a punt!
Will update in due time.
Manage your risk! #DYOR

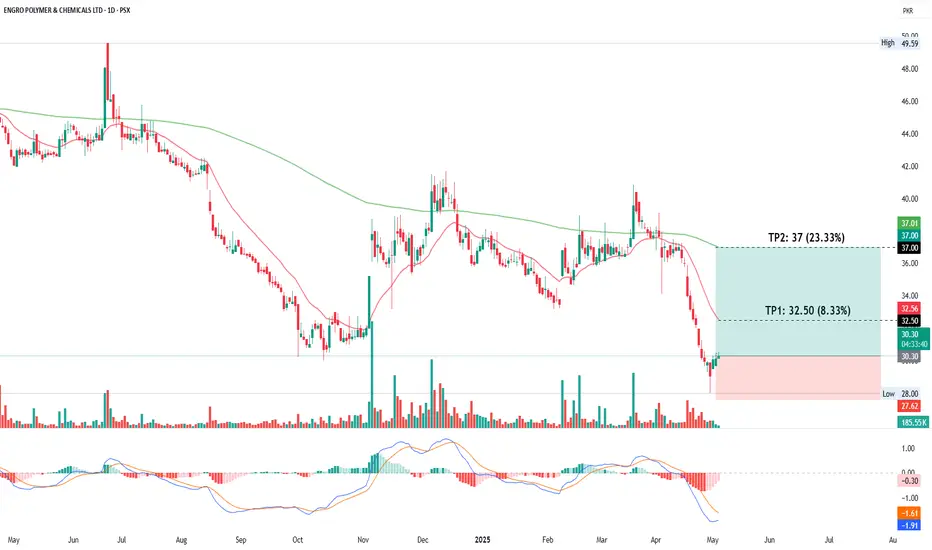
EPCL Shows Bullish Reversal Potential with MACD Crossover & EMAThe daily chart of EPCL indicates a potential bullish reversal. The price recently rebounded from a low near 28 and is now trading at 30.50, showing signs of recovery. The MACD indicator is on the verge of a bullish crossover, suggesting increasing upward momentum. The immediate target (TP1) is 32.50, which aligns with the 20-day EMA, while the second target (TP2) is set at 37.00, corresponding to the 200-day EMA. These levels represent 8.33% and 23.33% potential gains, respectively, and may serve as key resistance levels in the short to medium term.
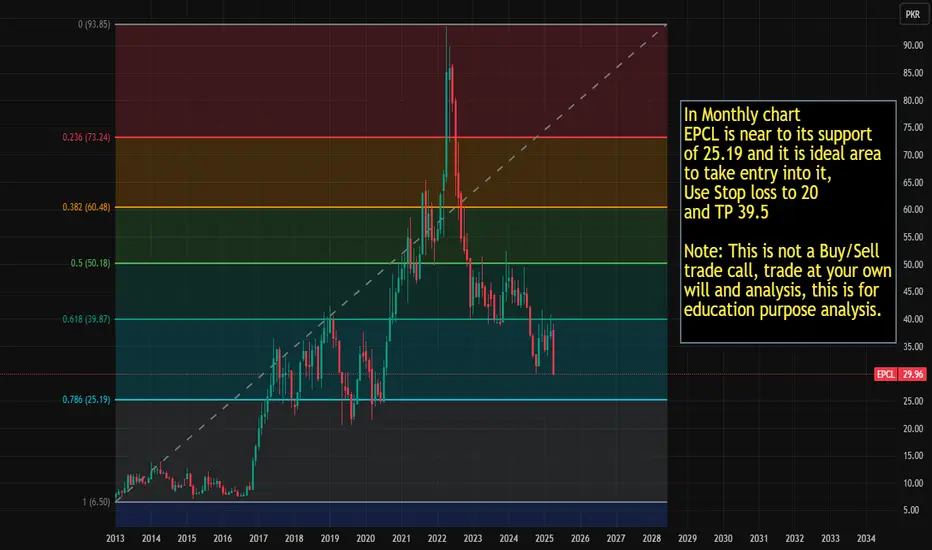
EPCL is in ideal range for entry. In Monthly chart EPCL is near to its support of 25.19 and it is ideal area
to take entry into it, Use Stop loss to 20 and TP 39.5
Note: This is not a Buy/Sell trade call, trade at your own will and analysis, this is for education purpose analysis.
EPCLA symmetrical triangle trade involves entering a position after price breaks out of a converging triangle pattern. Trade with confirmation (volume increase) and set stop-losses outside the pattern to manage risk.

EPCL: Early Signs of Spring.After posting the intraday high of 93.48 on 26th April 2022 the security has never been able to come out of selling pressure. On 14th October 2024 the price of 30.01 was printed as the lowest of recent times. From this point onward the Bulls have been trying to get a foothold and some early signs of there success have been noticed.
For those who like to do bottom fishing may initate a long position as has been indicated on the chart, wheras who want to play even safer may go long when the price is above TP1.
For those who initiate long after TP1 the TP2 shall be 50.
Pl do share your opinion as we learn together.

EPCLEPCL made high of is 41.70 and came down to 35.85 and took support from this level and broken the retracement line and its first Target 🎯Price can be 38.68.
Stopp Loss should be: 35.00
BUY

Inverse Cup & Handle..If 34 - 35 is not sustained, we may see
Selling Pressure & ultimate target can be
around 30 - 31 as Inverse Cup & Handle has appeared.

EPCL, Weekly Bearish TrendWeekly Bearish Channel
Broken weekly support @ 40
Currently Retesting Support
Weekly closing above 40 will target it towards 52
Fail to break 40 will be an opportunity for short
short target 21-25

EPCL is ready to fly to 45EPCL has broken bearish trend and now it could fly to 45 level
Use Stop Loss as per your risk taking methodology
Note: this is not a buy/sell call. This is analysis

EPCL - Long EPCL has given a breakout of a very strong trendline and there is a bullish divergence adding confluence of a trend reversal. Hence, going long on EPCL in PSX.


EPCL is BullishPrice was in a strong downtrend, however a bullish divergence led to the break of previous lower high indicating the control of bulls, if the pressure sustains then we can expect a bullish reversal. However, caution must be practiced as it is a risky setup. There is a high probability that the asset would go into an accumulation phase before a bullish rally. Targets are mentioned on the chart.

EPCL🚀 Stock Alert: EPCL
📈 Investment View: Technically Bullish 📈
🔍 Quick Info:
📈 Entry Level: 43.30
🎯 Target Level: 45.50
⚠ Stop Loss: 42.20
⏳ Nature of Trade: Short Term (Scalping)
📉 Risk Level: Medium
☪ Shariah Compliant: YES
💰 Dividend Paying: YES
📰 Technical View: The current price movement is evaluating a support level, coinciding with the observation of a Doji candlestick pattern, traditionally interpreted as indicative of a potential reversal in market direction. Furthermore, the Relative Strength Index indicates an oversold condition. Consequently, a strategic assessment suggests contemplating a long position entry point at the resistance level of 45.50.

EPCL breaks continuation pattrenContinuation patterns, including triangles, flags, pennants, and rectangles, provide some logic on what the market may do. Often these patterns are seen mid-trend and indicate a continuation of that trend, once the pattern is complete.

Though there is Bullish Divergence on Weekly TF butThough there is Bullish Divergence on Weekly TF but
it broke its Important Support around 40.
Last Week's Candle is a Doji Candle; now coming
week's Candle would decide its next move.
Also Currently, it is Near Trendline Support; lets see
if it is respected or not.
If it isn't sustained, we may witness 26 - 28.

Bullish on EPCLI expect epcl to explode from current levels and make new highs. According to time cycles the stock consolidate for 3.5 years approx before every bullish cycle. Each time after cosolidation the stock has given a 3x retrun to its shareholders.

EPCL is BullishEPCL has broken previous lower high and hence is looking good for an upward move. Targets are mentioned on the chart.

PSX: EPCL OPPORTUNITY FOR SMART ENTRY.EPCL is a chemical company providing raw materials to many construction related indutries.
It has been in downtrend for very long. Recently it hit the low of 38.5 which is the lowest low so far. From this point it reversed and posted a high of 47.95, which is a significant gain. Than comes retracement which is a natural eventuality.
If we apply fib. retracement to this gain we realize that price, almost, retraced to the level of 0.38 which is a healthy sign and to day it has printed a green candle which may be a clue to reversal. the only caution to this scenario is the volume, which is lower than the 20sma.
Here it will be advisable to keep close monitoring of the security and we may use fib. level of 0.5 as support levels and conformation with high volume can trigger a buy call.
At 49.25 we have a resistance on the chart, when crossed shall lead to TP-2.

EPCL Channel Broken, correction is expected,
Double bottom formation on cards.
Below are given Strong Support Zone
as per time frame.
Out come : Slow Accumulation is advised..
Supports:
Daily
43.80 - 43.20 - 40.80 - 39.70
Weekly
43.20 - 39.70
Monthly
37.70
Muhammad Ovais

EPCL Support may play well here, else in case support is broken then expect 39.75 double bottom
upper side is open accumulation shall be done.
