Bearish Divergence on Weekly tf.FEROZ Update
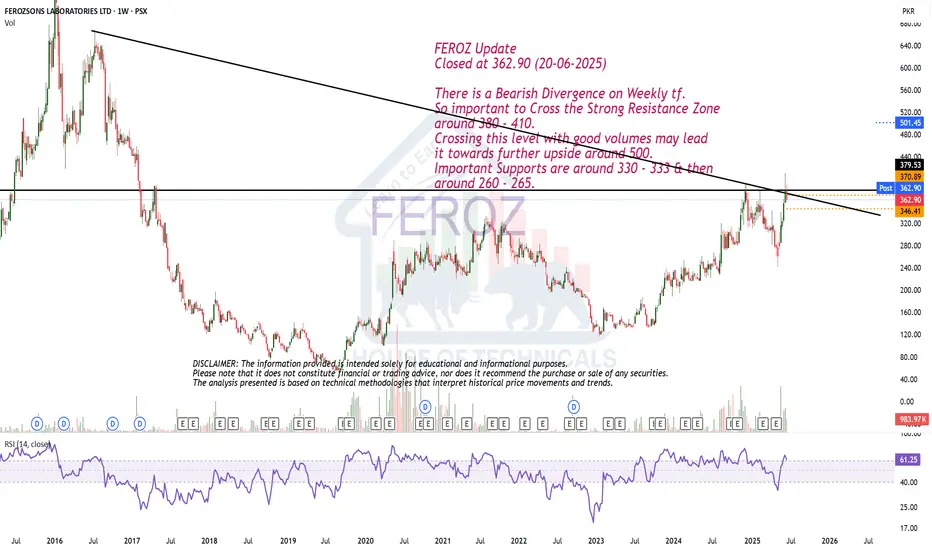
Closed at 362.90 (20-06-2025)
There is a Bearish Divergence on Weekly tf.
So important to Cross the Strong Resistance Zone
around 380 - 410.
Crossing this level with good volumes may lead
it towards further upside around 500.
Important Supports are around 330 - 333 & then
around 260 - 265.
FEROZ trade ideas
FEROZ LongFEROZ just touched its channel top this month and breaking it (410) will open up its way to further upside targets of 482, 581 and then 722 in medium term.
Further, a beautiful inverse head and shoulders formation is already complete... Breakout expected next month insha Allah.
Its my personal opinion, not a buy / sell call

Stock is Bullish but..
Closed at 356.30 (05-06-2025)
Stock is Bullish but closed just below the
weekly resistance.
However, if it gives weekly closing above
354 - 355, that would be OK & it may
give quick gain till 360 - 365.
Otherwise, we may witness 343 -345 &
then around 325 - 330.

Very Good Monthly Closing.
Closed at 323.58 (30-05-2025)
Very Good Monthly Closing.
Seems like Crossing the Resistance of 329-330
this time.
Potential to touch 390 -400 initially & then
500+ if 395 is Sustained.
However, should not break 305 - 307.

Feroz - Long Feroz is making cup and handle formation. Further, it is in an upward trend, breaking which may lead it to go beyond 550 (Exact medium term targets mentioned in chart). In the longer run, (1.5 to 2 years), it may again touch its all time high (900+).

Cup & Handle Formation; Bullish Flag FormationPlan1
Buy1 around 208 - 210 | Sell around 215 then 225
Buy2 around 198 - 201 | Sell around 210 - 215
Stoploss 189 (Closing Basis)
Plan2
Buy Above 242
Sell around 247 - 253 then 280 then 300
Stoploss 239 (Closing Basis)

Feroz Technical Analysis: Potential Buy OpportunityFeroz currently displays a bullish trend supported by key indicators. Price has rebounded from a trendline and is trading above the 89-day EMA, a historically significant support level respected by the price action. A recent support zone bounce and alignment with the Fibonacci Golden Ratio further strengthen the bullish outlook. Buy levels are 330 (CMP) and 310, with a stop-loss set on a closing price below 275.
Happy trading!

FEROZ is showing a Bullish Flag on 1D timeframeFEROZ is in uptrend as it is forming HHs and HLs on 1D timeframe. The price chart has formed shape of a Bullish Flag whereas RSI shows no divergence. As a rule of thumb, entry position has been marked on chart in BLUE on breakout of pole. Target has been placed in GREEN. SL is visible in RED. The stock looks like a good buy at trigger levels.
