Bullish on Monthly tf.FFL
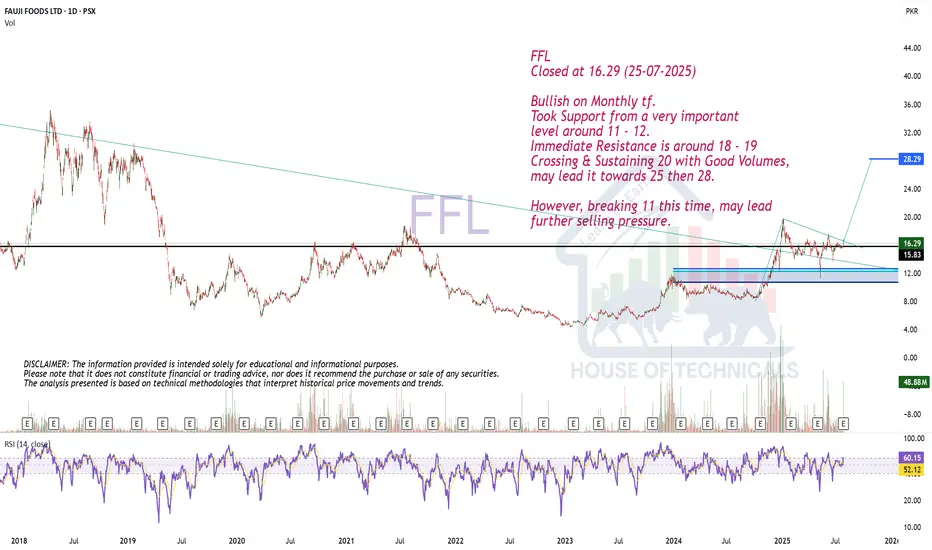
Closed at 16.29 (25-07-2025)
Bullish on Monthly tf.
Took Support from a very important
level around 11 - 12.
Immediate Resistance is around 18 - 19
Crossing & Sustaining 20 with Good Volumes,
may lead it towards 25 then 28.
However, breaking 11 this time, may lead
further selling pressure.
FFL trade ideas
Strong Stock!FFL
Closed at 15.22 (27-06-2025)
Sustaining 13.81 on Monthly basis
would be a healthy sign.
Also Monthly Closing above 16.12
would be a very positive sign.
On the flip side, 12 - 14 may act
as a Good Support zone.
Upside targets can be 19 - 20
& then 22 - 23 initially.

Re-testing breakout level.FFL Closed at 16.57 (11-06-2025)
Re-testing breakout level.
Sustaining 15.20 is Important.
Upside Targets are Still Intact.

FFL Next Buying Zone in Daily Chart FFL Next Buying Zone in Daily Chart
buying Zone 15.21 to 15.60.
This is for educational purpose. Do your own research for any financial investments.

Inverse H&S pattern.Closed at 16.75 (04-06-2025)
Inverse H&S pattern.
Sustaining 16.45 may lead it
towards 18.70 - 19 initially
& then 20.50 - 21.50
Stoploss is Must!

FFL | Inverse H&SFFL is forming Inverse Head and Shoulder Pattern on daily time frame, which a bullish reversal pattern, currently the stock is at neckline resistance upon break out and retest more upside towards 19.50 is expected.

Nice Setup15.30 - 15.50 important to sustain for further upside
Important Resistance is around 18 - 18.70

FFL SHORT TRADEFFL has broken down its major support with heavy volumes as shown by waves and their volumes.
SHORT FFL @ CP and 14.40
TP1 12.35
TP2 11.65
SL 15.1

Hidden Bullish DivergenceHidden Bullish Divergence is there.
Monthly Closing above 16.09 is Important
for further upside.
16.09 - 16.20 is the Resistance as of now.


FFL THE PERFECT SETUP REVIEW AS DEFINED FFL tested the same key levels which I find through secret price action and institutional order flows. I don't want to repeat you can just look at the chart and its beauty.

FFLFFL Stock Analysis:
- *Buying Opportunity:* FFL is providing a buying opportunity.
- *Strategy:* Adopting a "buy on dip, sell on strength" strategy.
- *Buying Range:* 16.26 - 15.30
- *Stop Loss:* 14.70
- *Target Levels:*
- First target: 17.50
- Second target: 19
- Final target: 21

PSX FFL TRADE IDEA LOOKING STRONG ON H2 AND H4FFL IS LOOKING STRONGON H2 AND H4. The stock retest its equal low where all of the big liquidity was resting at 14.50 Now the stock is heading to the next h2 resistance the breakout at H2 resistance with good volume will start a quick uptrend. Watch for volumes and orderbook.
The next target will be the previous lower low around 16.
Trading above EMA 21 at H2 AND H4.
VOLUME GAINER.
Buy before breakout if the volumes are rising watch on shorter time frame and see how the price reacts near the resistance. WATCH THE ORDERBOOK MUST and see what is being played there.

BullishBullish on All Time Frames.
Strong Bullish Divergence on Weekly TF.
However an Important Resistance is around 15.70 - 16.
If Crossed & Sustained with Good Volumes, we
may witness 18 - 19.
Bearish Divergence on Daily TF may show some
Selling pressure.
In Simple Words: Stock is Good to Hold with Proper
Stoploss (as per your own Risk appetite.)
For Fresh Entry, following ranges can be considered
1. 14 - 14.15
2. 12 - 12.10

FFL - NEUTRALThat stock is in falling mode now take observation on the moves in future with the respect of support and resistance .

PSX- Analysis of Fauji Foods LtdTechnical Observations:
Harmonic Pattern:
The chart depicts an ABCD harmonic pattern with the price currently at point C.
Point A: 12.20
Point B: 19.80
Point C: 15.10 (0.618 Fibonacci retracement of AB)
Target D: 23.94 (Fibonacci extension of AB).
Fibonacci Levels:
Key Support Levels: 16.00 (0.5 retracement), 15.10 (0.618 retracement), and 13.83 (0.786 retracement).
Resistance Levels: 18.00 (0.236 retracement) and 21.00 (recent high).
Volume:
Increasing volume at C suggests potential reversal and accumulation near this support level.
RSI:
The RSI shows a recovery from oversold levels, indicating bullish momentum.
Trendline:
Price is respecting an upward trendline from point A, supporting a bullish bias.
Trade Plan
Entry Strategy:
Buy Zone: Enter near the current price of 17.58 or on a pullback to 16.90–16.00 for a better entry.
Target Levels:
Primary Target (TP1): 19.80 (point B and resistance).
Secondary Target (TP2): 21.00 (recent high).
Final Target (TP3): 23.94 (point D, harmonic completion).
Stop-Loss:
Place the stop-loss below 15.00 (0.618 retracement), ideally at 14.50, to account for market volatility.
Risk-Reward Ratio:
Risk: ~3.08 points (17.58 - 14.50).
Exit Strategy:
Partial Profit Booking: Close 50% of the position at TP1 (19.80).
Trailing Stop: Move the stop-loss to breakeven after TP1 is reached.

FFL Long IdeaA bit late, but it still has the potential to make an impact.
All targets and stop loss given on the chart

FFL still offers confirm 9% returnsThe stock has alhamdulillah achieved TP1 and now riding towards TP2 of 19.28.
Instant entry can be made here for 9% quick gains

FFL - PSX - Monthly Technical Analysis - SHARK Harmonic PatternOn monthly time frame FFL is following SHARK Harmonic pattern.
In the present bull run, prices are moving up swiftly.
125% gains in next 4 months are quite obvious.
One may take Swing trading for a week till TP-1 as RSI and KVO both suggests that TP-1 is quite easily possible. Then subsequently TP-2 as well. For TP-3 one may reenter the trade on dip expected after TP-2. However, January is always very bullish and one never knows if TPs are achieved much earlier.
Trade Values
Buy (Mkt): 16.30
TP-1: 18.52
TP-2: 23.06
TP-3: 30.33
TP-4: 36.56

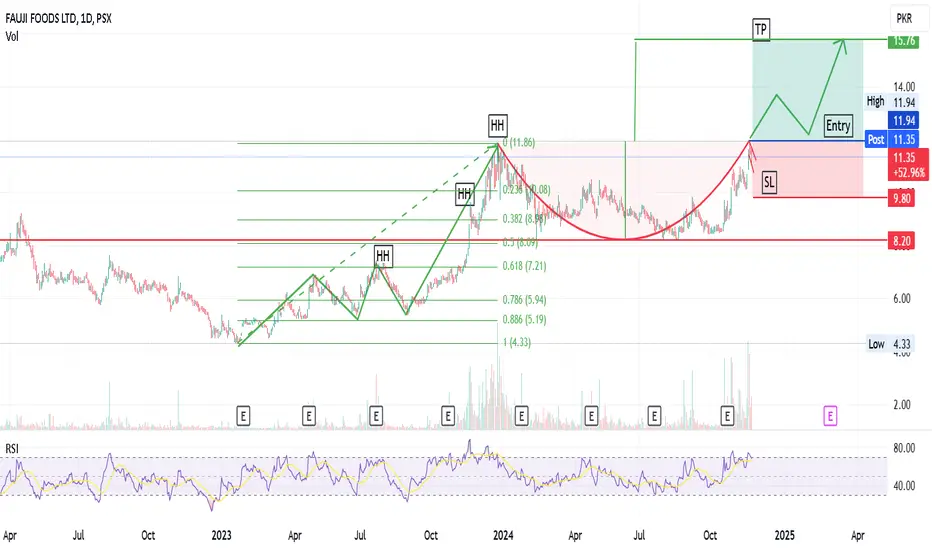
FFL- Buy SetupIn the past FFL was printing HH and HL, After that it retraced upto Fib value of 50%. It is making classic Cup & handle patterns on daily and 4h time frame, Breakout of top of cup level will give strength to Bulls, and price may go to 15.75 level.
Entry after break out
SL below last LH
Expected TP 15.75
FFL: Potential Bullish Targets AheadFFL highlighting a potential "cup and handle" pattern. The price recently broke out above a downward-sloping trendline, marking the handle's resistance at approximately 11.86 PKR, suggesting a potential bullish reversal. Key resistance levels are marked at R1 (14.82), R2 (16.47), and R3 (18.70), providing potential targets if the upward trend continues. This breakout from the handle's resistance could indicate a momentum shift, with the next targets aligning with these resistance levels, confirming the pattern's bullish implications.

FFL is BullishPrice is in a strong uptrend, and after a good retracement the price seems to be on track for next leg up. According to AB = CD pattern also the projected target for this rally are around 15.50, which seems easily achievable as there is no divergence yet on the daily time frame with bulls in the driving seat. Targets are mentioned on the chart.

FFL is going to high and highCurrent financial results of FFL are good and company is now in good profit, This is monthly chart of FFL, FFL currently is undervalued stock and it was trading between 8 and 9 levels few days ago and on last trading day it crossed psychological barrier of level of 10.
These are levels could be crossed by FFL in future, Keep in mind it is starting to rise and it will rise day by day.
Note: This is an analysis on Fundamentals and Technical basis, This is not a buy or sell call. Trade with your own will and decisions.
