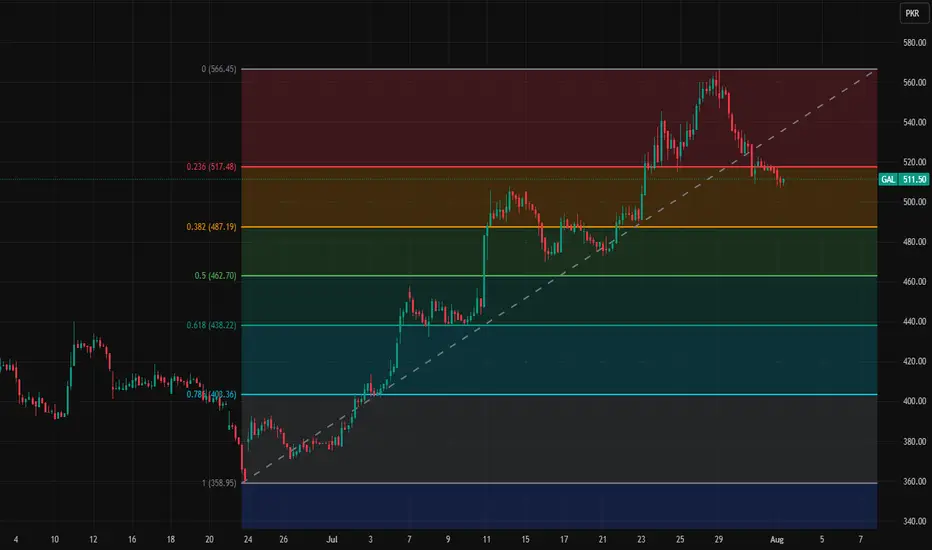
GAL short term key levelsThese are short term key levels on 1h
chart
566.45
517.48
487.19
462.7
438.22
403.36
358.95
GAL trade ideas
GAL on the rise after breakoutgal is rising after submitting breakout on daily charts, currently price has taken a correction which makes it attractive for buying at current price.

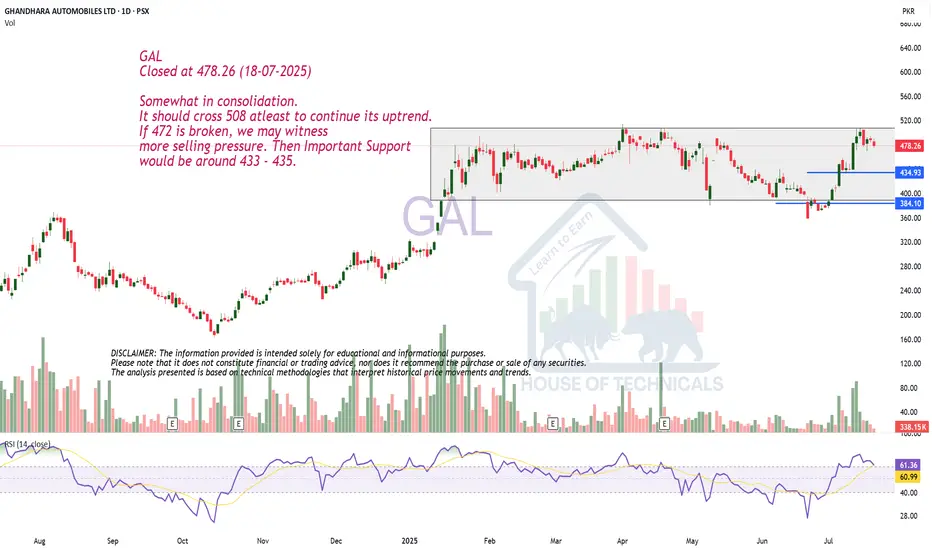
Somewhat in consolidation.GAL
Closed at 478.26 (18-07-2025)
Somewhat in consolidation.
It should cross 508 atleast to continue its uptrend.
If 472 is broken, we may witness
more selling pressure. Then Important Support
would be around 433 - 435.
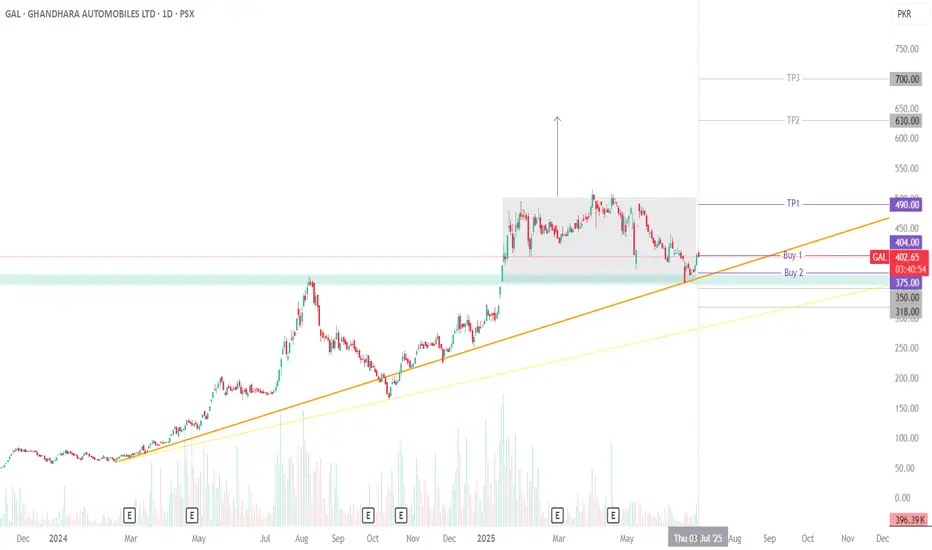
GAL Technical Analysis: Bullish OpportunityGAL (Ghandhara Automobiles Ltd.) is showing a strong bullish setup. Price is holding above its trendline after bouncing off solid horizontal and rectangle support zones. On top of that, GAL has a history of performing well in July, which adds a seasonal boost to the setup.
Fresh entries can be considered at the CMP, while for averaging or pullbacks, 375 and even 350 could offer attractive buy zones if the price dips.
For risk management, there are two stop-loss options: a conservative one below 318 to guard against broader breakdowns or gap fills, or a more aggressive one on a closing basis under 350, just beneath key structure.
Take Profit 1 at 490 lines up with rectangle resistance. A strong close above this opens the door to the next projection around 630. If price manages a firm close above 630, momentum could drive it further, with the AB=CD pattern pointing toward a stretch target near 700.
Trading Recommendations:
Buy 1 (CMP): 404
Buy 2: 375
Stop-Loss (Aggressive): Closing below 350
Stop-Loss (Conservative): Closing below 318
Take Profit 1: 490
Take Profit 2: 630
Take Profit 3: 700
Happy trading!
GAL (WEEKLY): Targeting 600 – 730 by Q1 2026#GAL (WEEKLY): Targeting 600 – 730 by Q1 2026
CMP: 447.89
#GAL seems to follow a cyclical rhythm of ~34–36 weeks (approx. 8–9 months) between impulsive rallies.
After strong rallies from Feb 2024 to Oct 2024, and again Oct 2024 to Jun 2025, a similar cycle is now in motion.
The most recent bounce near trendline support aligns with the next cycle start (June 2025).
Based on the channel’s slope and volume breakout, GAL may attempt a move toward 600–730 by early March 2026 (next cycle completion).
The dotted upper trendline and past Fibonacci-based extensions both validate this upside zone.
If momentum sustains and GAL holds above trendline support (around 400), the chart suggests a third impulsive wave could be underway. While speculative, the pattern rhythm and price geometry point toward 600–730 as a realistic upper zone into early 2026 — barring major macro disruptions.
This analysis is for educational and informational purposes only. It does not constitute investment advice or a recommendation to buy or sell any security. Always conduct your own research or consult with a licensed financial advisor before making investment decisions. Past performance is not indicative of future results. #kse100 #psx #tradeflow #GAL #pakistan

GAL | When To, How To?The weekly chart of GAL shows a strong bullish reversal after a prolonged correction phase. The stock has surged by nearly 19% this week, indicating renewed buying interest and potential trend continuation. Key resistance zones lie at 610 (mid-term target) and 730 (final target), while support rests near the breakout area of 446. Sustaining above this level may lead to further upside, though minor pullbacks could occur as part of healthy profit-taking. Overall, the chart structure favors a bullish outlook with a medium- to long-term perspective.

Play on Levels.GAL Analysis
Closed at 408.92 (03-07-2025)
Important Support is around 367 - 382
Resistance is around 433 and then around
450 - 455.
Crossing 460 may lead it towards 500+
However, breaking 365 may bring more
selling pressure towards 340.

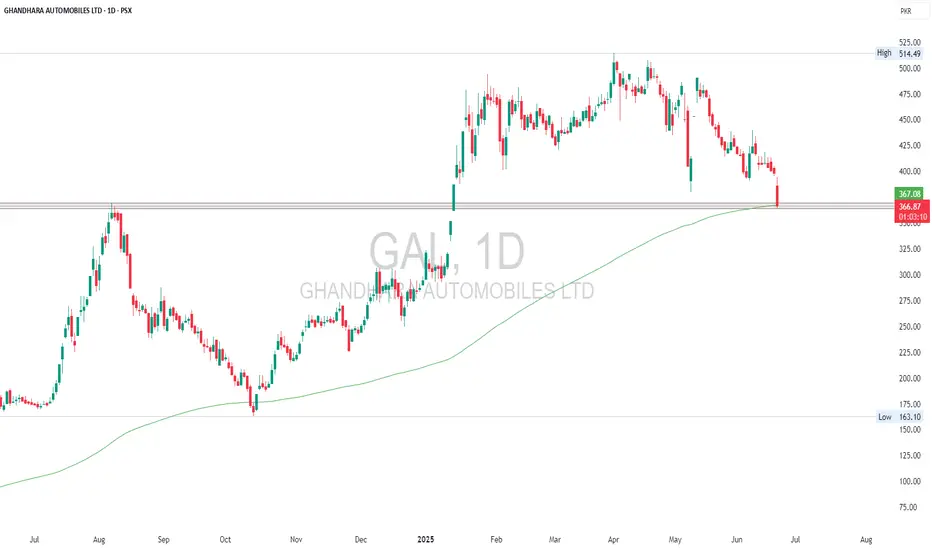
GAL | Confluence of Support & ResistanceGAL is currently testing a critical support zone near 366, which aligns closely with the 200-day EMA (367). The stock has seen a sharp drop with increased volume, suggesting strong selling pressure. However, this area also coincides with previous resistance-turned-support, making it a potential bounce zone. Holding above this level could lead to a reversal, but a breakdown below may trigger further downside.
GAL LONG TRADEGAL is in a Consolidation since past 5 months- the simple Rule of Trading Ranges is "BUY LOW AND SELL HIGH". GAL has been trading towards channel bottom and now has shown a significant reversal confirmed by HL, VG and price crossing over EMA-20 on 1H TF.
🚨 TECHNICAL BUY CALL –GAL🚨
🎯 BUY ZONE: Rs. 425-430
📈 TP 1: Rs. 445
📈 TP 2: Rs. 468
📈 TP 3: Rs. 490
🛑 STOP LOSS: Below Rs. 413 (Daily Close)
📊 RISK-REWARD: High Conviction | 1:5
Caution:
Buy in 3 parts within given range - Please close at least 50% position size at TP1 and then follow strict trailing SL to avoid losing incurred profits in case of unforeseen market conditions.
SHARE AND BOOST IF YOU FIND THIS HELPFUL

GAL SHORT TRADEGAL has recently broken down its upward Trendline and posted a Lower Highafter giving Shortening of Thrust
Short Sell GAL 470-490
TP 422
SL 510


Gal entered into Bullish zoneGal is entered into bullish zone and may gross 500 and 550 level.
Note: This is not a buy/sell trade call, it is for education purpose, use stop loss.

GAL (Ghandhara Automobiles) – Bullish Setup EmergingGAL (Ghandhara Automobiles) – Bullish Setup Emerging;
LDCP: 472.83
Ghandhara Automobiles (GAL) is respecting its rising channel beautifully. A Bullish Doji Star has appeared near the lower boundary of the channel, signaling a potential reversal. The Stochastic RSI is extremely oversold (below 10), strengthening the case for a rebound.
As long as GAL holds above 460–462, a bounce toward *** and *** remains likely. A daily close below *** would negate the bullish bias.

No Bearish Divergence yet on Shorter TF.
No Bearish Divergence yet on Shorter TF.
Good Support is around 465 - 467.
However, Crossing 520 with Good Volumes
may lead it towards 600+
Even In worst case, it should not break 400.

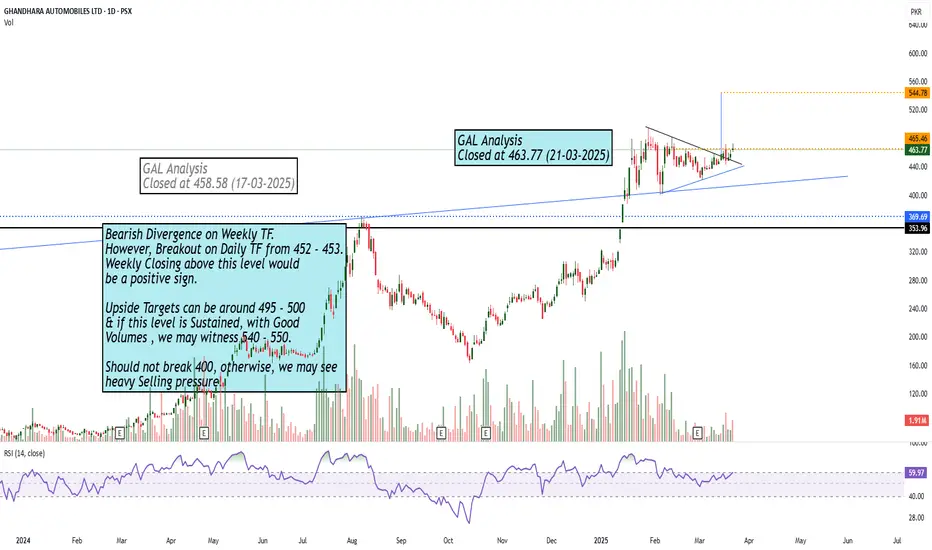
Bearish Divergence on Weekly TF but..Bearish Divergence on Weekly TF.
However, Breakout on Daily TF from 452 - 453.
Weekly Closing above this level would
be a positive sign.
Upside Targets can be around 495 - 500
& if this level is Sustained, with Good
Volumes , we may witness 540 - 550.
Should not break 400, otherwise, we may see
heavy Selling pressure.
Bearish Divergence on Weekly TF but... there is a Breakout..Bearish Divergence on Weekly TF.
However, Breakout on Daily TF from 452 - 453.
Weekly Closing above this level would
be a positive sign.
Upside Targets can be around 495 - 500
& if this level is Sustained, with Good
Volumes , we may witness 540 - 550.
Should not break 400, otherwise, we may see
heavy Selling pressure.

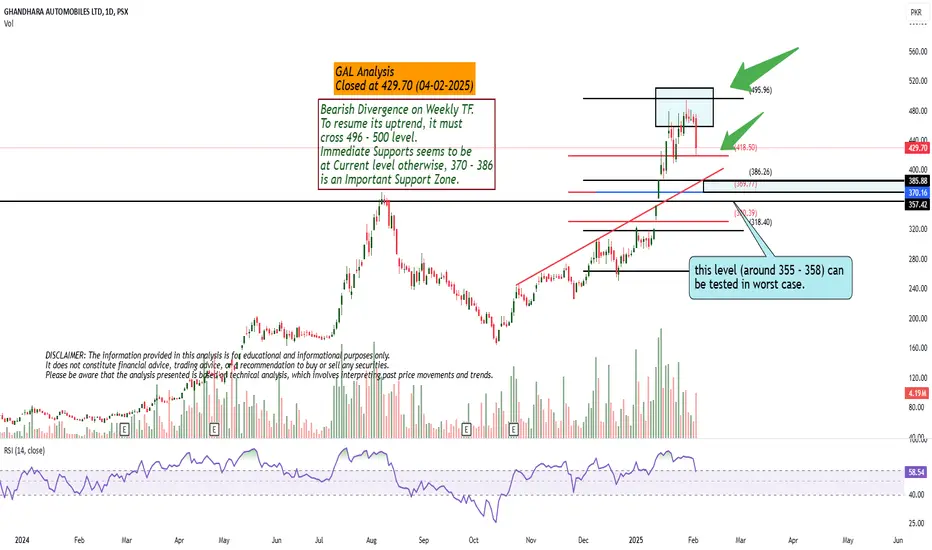
Bearish Divergence on Weekly TF.Bearish Divergence on Weekly TF.
To resume its uptrend, it must
cross 496 - 500 level.
Immediate Supports seems to be
at Current level otherwise, 370 - 386
is an Important Support Zone.
Though Bearish Divergence is appearing on Weekly Tf; butThough Bearish Divergence is appearing on Weekly Tf;
but no Bearish Candle yet & crossing 425, it may hit 445 - 450.
However, Friday's Closing is Important.
It may retrace up to 358 - 370 & a Good Bounce
is then expected. That may be considered a
Good Buying Opportunity.
& if 355 is Broken, we may witness 290 - 295.

Learning GALPlease check the monthly cup and handle pattern if it is formed than it can give you crazy returns. This is for education purpose only.

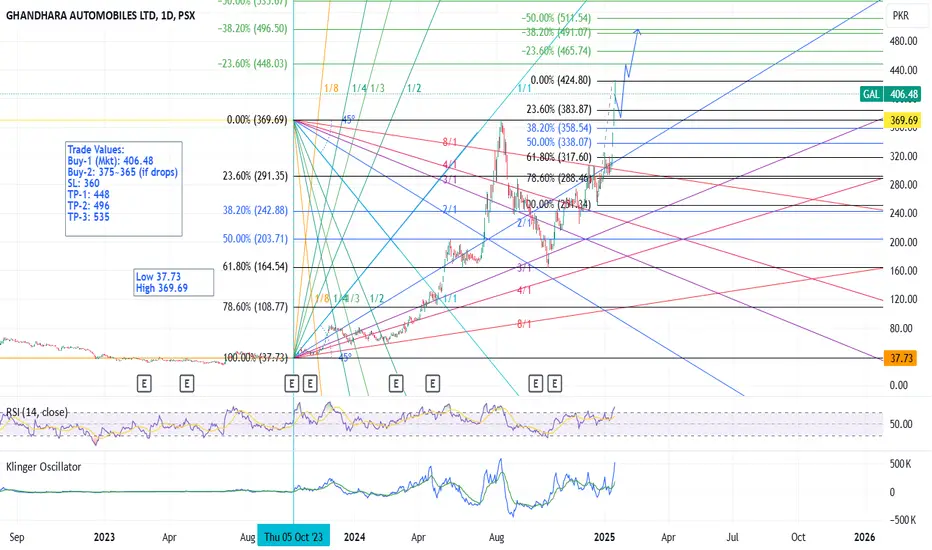
GAL - PSX - Tech AnalysisGAL has been moving up very sharply. After crossing the previous all time high now has established a support zone above it (365~375). Price has appreciated in one stretch quite a bit, therefore, I expect a retracement as well. So price may drop to 383 or even lesser.
RSI and KVO both are supporting a continuation of bull run.
TPs have been calculated on the basis of Fib Ext tool.
My trade values:-
Buy-1 (Mkt): 406.48
Buy-2: 375~365 (if drops)
SL: 360
TP-1: 448
TP-2: 496
TP-3: 535
GAL, Inverted Head and ShoulderInverted Head and shoulder formation
Bullish Channel
Critical resistance broke
towards new highs
buy @ CMP
Sl on Bullish Channel Break @ 224
TP1 307
TP2 367

GAL READY TO TOUCH ITS PREVIOUS HH OF 360+Currently the stock has completed its retracement till 0.786 level on FIB, daily closing above 274 will post another capital gain of 9-10%, Initial TP is 300 with SL @ 216.5, TP2 as per the risk reward ratio of 1:1 is 331.5 and TP2 with RR of 1:2 of 389 rupees potentially offering 43% gain.
The stock as per ABCD pattern exposing the initial target of 300, giving daily closing above 300 will further open the horizon of 330 onwards. Trailing stoploss levels could be applied to maximize the gain, if an entry is made at 274

STILL BULLISH ON LONGER TFSeem to have a potential to touch 230-240 once.
dips can be considered as a buying opportunity.
however, should not break 158 - 159.
