Short Term & Long Term ViewShort Term View:
Bullish Divergence on Hourly TF.
Immediate Support is around 242 - 243.
However, a Very Important Level is
around 237 - 238.It should bounce from
this mentioned level, &
may give you an upside around 253 - 255 or
may be around 260 - 262.
GAL trade ideas

Please Manage Your Trade AccordinglyThough our Mentioned Resistance Levels played
well, but Our Stoploss Hit at 310 on Friday (17-08-2024)
as per Call # 441.
Still Bullish on Weekly as well as Monthly TF.
If 289 - 290 is Not Sustained, Next Strong Support will be
around 239 - 24 and then around 199 - 200.
In Short Run, again if 289 - 290 is Mot Sustained, Next
Support will be around 265 - 267 and then 239 - 242.
.

GAL @ Resistance LevelWeekly Candle Closed
below the Resistance Point.
It needs to Break & Sustain
355 initially for further upside.


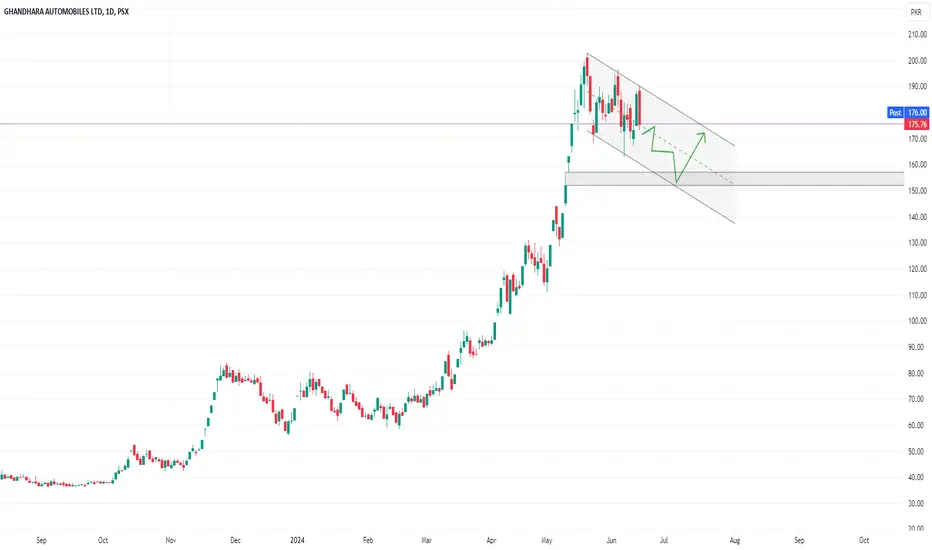
GALFlag Pattern Formation On daily Timeframe⏳
Flag support range 152-157
Flag resistance around 173-175
This is just my observation, do your own analysis before take long or short positions
GAL ANALYSIS 3.0🚀 Trade Alert: GAL Bullish Flag Pattern 🚀
We have identified a bullish setup in GAL, characterized by the following:
Bullish Flag Pattern: Indicating a potential continuation of the uptrend.
No Divergence: Supporting the bullish outlook.
Entry Point:
Buy Stop: At the recent high of 190
Target Prices (TP):
TP 1: 210 📈
TP 2: 230 🥇
Stop Loss (SL):
SL: 168 to manage risk
Trade Summary:
Buy Stop: At 190
TP 1: 210
TP 2: 230
SL: 168
Trade Type: Long Swing 🎢
Good Luck! 🍀
Stay informed and trade smart! 📊

GAL:- BULLS HAVE TAKEN CONTROLGAL posted hefty gains in the first leg of its journey to north. After resting bulls have started the 2nd phase of journey. At 240 bull shall face some resistance and when its over the next target shall be 360.
Pl exercise strict financial discipline, as this is the key to success.
Have profitable trading.

GAL - BullishGAL has formed a bullish flag pattern. Currently it is trading near its previous high. Buy is recommended when it breaks the previous high. Buy with proper risk management

GAL ANALYSIS 2.0"It appears that GAL has formed a reversal pattern, a double top, accompanied by RSI bearish divergence. 📉 Additionally, the neckline has been broken, and a bearish flag is forming. To capitalize on this potential downward movement, I recommend placing a sell stop order. Set your stop loss (SL) at the recent higher high (HH) and take profit (TP) levels according to your risk-reward ratio. This strategy combines technical analysis and risk management for a potentially profitable trade. Best of luck with your trading! 🍀📉"forming to sell

a Beautiful Cup & Handle Pattern on Weekly TF.
Possibility of Re-Testing its Previous High around 148 - 150.
On the flip side, 203 & then 220 is a Strong Resistance level.

GALGAL has shown a break out on 4 hour time frame. Short term position can be consider around 193.50 for the target of 202.80. If it breaks previous resistance of 202.80 then more upward can be expected.

GAL Analysis 2.0Gal forms an ABCD Pattern indicating targets at 217 and 231 respectively.
Place stoploss at 180.
Instant buy at CMP or 196.
Best of luck.

GAL Analysis 2.0Gal forms an ABCD Pattern indicating targets at 217 and 231 respectively.
Place stoploss at 180.
Instant buy at CMP or 196.
Best of luck.

Bullish on All Time FramesPlan1
Buy1 around 81.50 - 82.55
Buy2 around 77 - 78
TP1 around 88
TP2 around 90
Stoploss 73 (Closing basis)
Plan2
Buy Above 89
Sell around 93 - 95 then 100
Stoploss 83.50 (Closing Basis)

Gal (Intraday/Short Swing).Gal closes At its High weekly resistance which now becomes its Support, so Good Closing.
Also Retraced to.50 fib from HH - HL
Very good.
Extremely Bullish for Short Target, exit your position from 117.5 - 120.
Long Target 150 after 120 closing with high volumes>
Buy Gal AT 113-115.
Sell at 117.50-120.


GAL - HH & HLGhandhara Automobiles Ltd - GAL - 1D: Price action is presently making higher high and higher lows with supports defined around 36-35.50 range. It appears that the stock is in the bullish momentum since price pulled back from 0.618 Fib level. 52.50 and 65.50 are the first and second resistance level respectively.


GALMaking LH LL on Hourly Basis
Daily Trendline Support seems around 62.50
0.618 fib level support around 63


GAL is BullishGAL is just getting warmed-up for a bullish rally, the current healthy correction was necessary for further upside movement. It all began with bullish RSI divergence on weekly time frame, and after giving a break out from the accumulation zone, bulls are in control, and currently there are no signs of exhaustion. AB = CD harmonics projection also indicates a potential 60% move from the current price. Targets are mentioned on the chart.
P.S Analysis is conducted on weekly time frame and hence could take 3-4 months to play out

GALPLAN 1
Buy1 : around 74
Buy2 : around 68
Stoploss 63
PLAN 2 : Trade on Breakout
Buy Above 80
Sell around 85 then 88
Stoploss 63 (closing basis)
