GCIL | Swing Trade Setup!!!GCIL's current price action indicates a favorable technical setup.
Key observations include:
Uptrend indication: The stock price is trading above the 200-day EMA, suggesting an overall uptrend.
Fibonacci retracement: A fake breakout was observed on April 3rd, which coincided with a 61.8% retracement level from the low of 8.82 (October 4th, 2024) to the high of 23.50 (March 3rd, 2025). The stock has since appreciated by 9.10%.
MACD crossover: The MACD indicator is exhibiting a bullish crossover from its bottom, signaling a potential reversal and strengthening of the uptrend.
Trading Strategy
Based on the technical analysis, a long position can be considered at the support level of 16.16. To manage risk, a strict stop-loss is recommended at 14.40. Potential targets for the trade are:
Target 1: 17.89, representing a 10.71% upside
Target 2: 20, representing a 23.76% upside
GCIL trade ideas

GCIL LONG TRADEGCIL has started its new leg of uptrend with big volumes
its low risk high probability BUY SETUP

Monthly Closing above 16.90 would be a Positive Sign. Monthly Closing above 16.90 would be a Positive Sign.
Immediate Resistance is around 18.80 - 19.80
On the flip side, 15 - 15.50 can be a Good Support.
& if this is broken, next Support would be around
13.50 - 13.80 which is also re-test level of Channel
Breakout.

18% gain in GCILThe company has successfully broke out the accumulation zone and now poised to make new HHs and HLs.
Entry can be planned on current rates or post closing 13.86. This will trigger the upside towards 21.4 as per the bullish flag projection while exit as per the trade plan is around 20
SL can be placed at 13.6

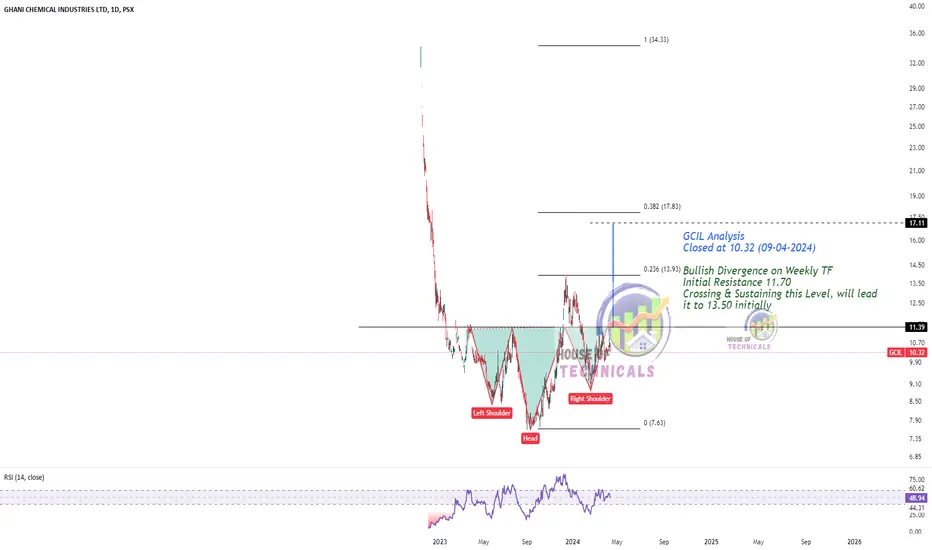
Bullish Divergence on Weekly TF
Initial Resistance 11.70
Crossing & Sustaining this Level, will lead
it to 13.50 initially
GCIL - LongCup and Handle pattern broke out
4H taking pullback after new HH
SL below last 4H HL (yellow markerd)
TP 1 at 1RR (25% offload) ride with rest.
No divergence found on RSI

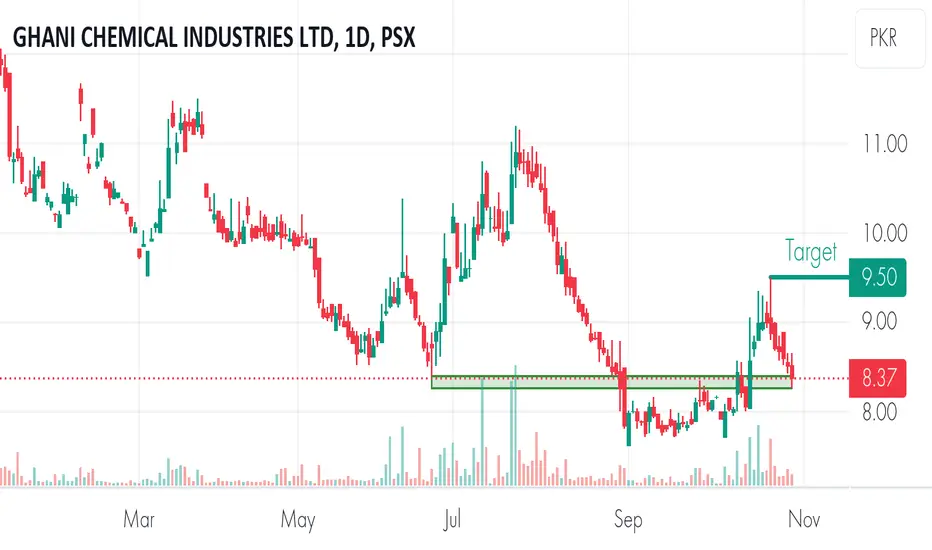
GCILBuy Above 11.70 (if sustained)
or wait to Buy around 10.30 - 11
Stoploss 9.50 (closing basis)
TP1 : 13.80
TP2 : 15.30

PSX: GCIL BULLS ARE GEARING UP FOR FRESH RALLY.GCIL staged a very healthy bull run. After some pause the bulls are taking control of the events. So join them
Trade Plan
SL 10.00
TP 1 14.78
TP 2
Entry Price 11.25

GCILPrice action is currently testing at support level. If this level sustains it can retest resistance level.