Conslidation Box
Closed at 9.14 (23-05-2025)
Trying to break the long consolidation box.
Important Support Zone is around 8 - 8.70
Channel bottom is around 5.30 which seems
unlikely as of now because of Bullish Divergence
on weekly tf.
Upside targets can be around 11 & then around 14
GGGL trade ideas

Monthly Breakout but still...Monthly Breakout; However, still at Important Resistance zone.
Once 10.70 is Crossed & Sustained, 12 - 12.50 can be easy Targets.
It has given a Breakout from Rectangular Channel around 8.70 - 9.
& also re-tested it.
Hidden Bullish Divergence has also appeared.
as of Now, it should not break 6.60.

GGGL: Potential Weekly Breakout TradeGGGL presents an interesting weekly trading opportunity. The stock recently broke out from an approximately 100-week consolidation period, signaling a potential long-term upside. Following the breakout, the price successfully retested the weekly support zone around 8. The weekly candle closed at the 0.5 Fibonacci retracement level, a key area for potential reversals. A bullish divergence initially signaled potential upside, and although the price subsequently entered a consolidation phase, the RSI has now synced with the price action, suggesting renewed upward momentum.
Trading Recommendations:
Buy 1 (CMP): 8.5
Buy 2: 7
Stop-Loss: Closing below 5.5
Take Profit 1: 10.5
Other Potential Targets: 16, 20, and 30 (near all-time highs)
Happy trading!

GGGL-LONGGGGL has started a bullish trend as price has broke a consolidation box and now making Higher HIghs and Higher lows,so take a long entry at CMP

GGGLScrip has the potential to go towards upside and therefore approximate Profit Targets marked for ready reference.

GGGL is BullishPrice seems to be in the accumulation phase on weekly time frame, however a matured bullish divergence hints the control of bulls, the bullish sentiment is further confirmed by the printing of first higher high. If this is broken in coming weeks then we can expect a bullish rally from here. Targets are mentioned on the chart.


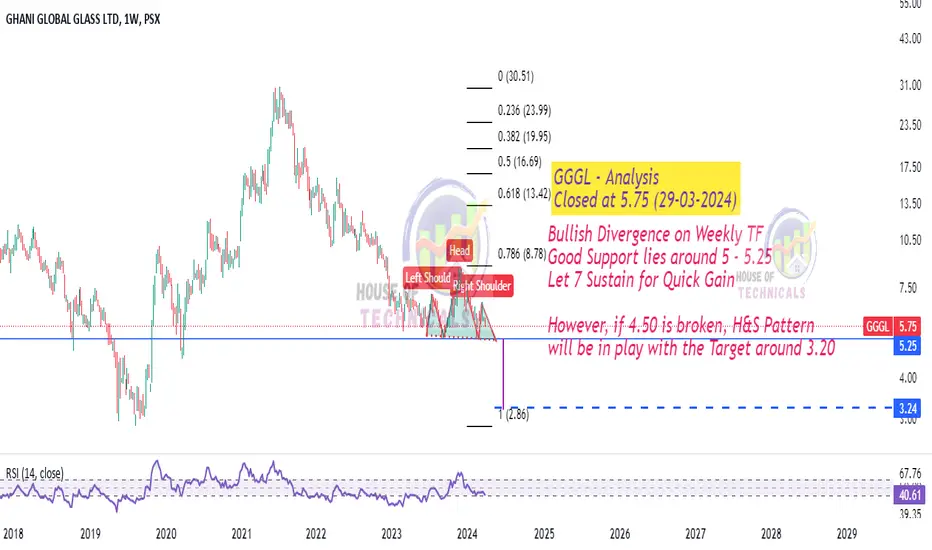
Bullish Divergence on Weekly TF
Good Support lies around 5 - 5.25
Let 7 Sustain for Quick Gain
However, if 4.50 is broken, H&S Pattern
will be in play with the Target around 3.20

PSX -GGGL GGGL is heading to breakout the Last Higher High. Weekly trend showing breakout after accumulation phase and indicating UP trend for long with heathy volume
Precise Entry:8.61
StopLoss:7.35
TP1:12.67
TP2:19.62

GGGLCup and handle pattern seems in GGGL. Break of level 7 can pull the price to its first resistance level of 10, if breaks and sustains it can reach to its next resistance around 14

GGGL : PSX - Bullish BAT / GARTLEYThe script after trending in a long-term Bearish trend, went into consolidation/ accumulation zone. Within the zone, its forming bullish reversal pattern with two possibilities currently i.e BAT or GARTLEY. Longs may be looked for

GGGL (PSX) - RANGINGThe stock has broken out of bearish trend and is ranging currently. Long positions may be looked for at marked support level or after break out of the range

GGGL (PSX) - RANGINGStock has came out of bearish trend and is ranging currently. Long position may be tried at marked support levels or after it breaks out of range
