GHNI trade ideas
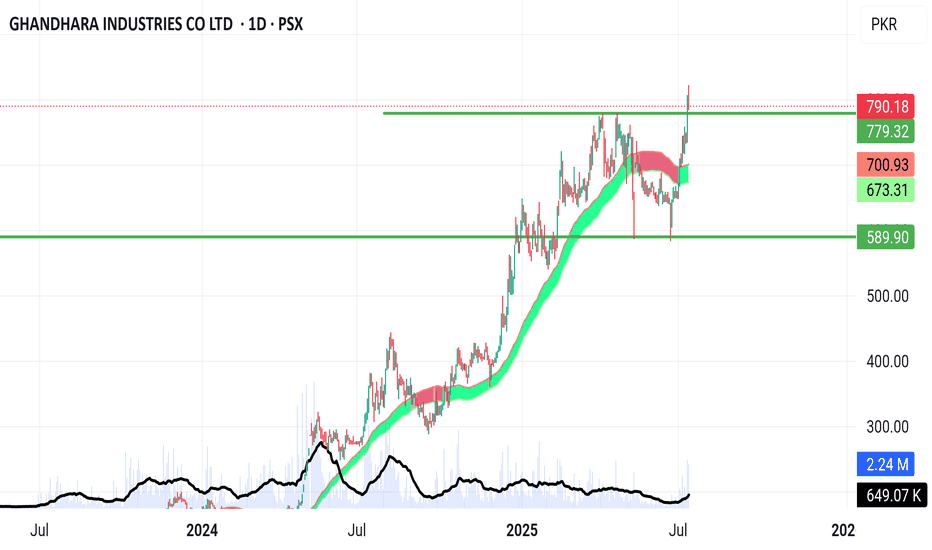
ABCD PatternGHNI Analysis
Closed at 738.08 (04-07-2025)
Monthly Closing above 648 would be
a positive sign.
784 - 785 is the Resistance for now.
It has the potential to touch 1000 - 1100
if it Crosses & Sustains 785 with Good Volumes.
On the flip side, 680 - 682 & then 657 - 660 may
act as a Support.
Very Good Weekly Closing.
Very Good Weekly Closing.
Monthly Closing above 780 is Important,
otherwise, Tweezer Top is Expected which
is a Negative sign.
Channel Top is around 825 - 830.
Initial Support seems around 700 - 705.
& Double Bottom (in case of Selling Pressure)
is around 640 - 645 (which may also act as Support).
GHNI BUY IDEA.AS per the Elliot wave theory we are in the 5th leg which is targeting 950 rs.
As of the current scenario , we are trading in a bullish parrallel channel.
with Hidden divergence formed + emas merging on this point we can expect a good bull move from 710-720 rs , targeting abv highs.
A bullish candle will be very good.
GHNI - CONTINUES TO B UPWARD, IS IT HEADING FOR 1000+ ???
Current Price: 764.04
Chart Setup: Uptrend within an Ascending Channel
Ghandhara Industries Ltd. (GHNI) has been experiencing a strong bullish trend, moving within an ascending channel over the past year. The stock has shown significant upward momentum, consistently bouncing between the support and resistance levels of the channel. Currently, it is nearing the upper resistance line, suggesting that further upside could be expected if the trend continues.
Monthly Closing is ImportantGHNI has successfully completed its Weekly
ABCD Pattern around 590 - 595.
However, there is No Bearish Divergence Yet on
Bigger Time Frames.
Monthly Closing above 592 - 595 would be a
Positive Sign.
However, it should retrace upto 540 - 550
once for a Good Upside Rally again.
Breaking 500 may bring further Selling Pressure.
GHNI offering over 30% gains from these levelsthe stock is continuing its uptrend and after making Cup and handle formation, successfully broke out the handle, if it posted daily closing above 444, the stock is likely to test its cup and handle projection of 590 which is a good return of ~32%
with a SL of 360, as per trade plan, entry should be made at 444, with TP1 of Rs. 528 and TP2 of 612, however, as per Cup and Handle projections, one can close the trade around 590 levels.
GHNI - INVERTED H&S PATTERN, TARGETING 224/-GHNI is showing a clear Inverted H&S pattern, as the price retraced to test the neckline at a level of 166. With a bounce occurring above this neckline, it appears likely to continue its upward momentum. Projected targets are set at *199 and 224 levels*, with solid support holding firm at 164
GHNI | Demand Vs Supply AreasAt present, GHNI demonstrates resistance at the 173.50 level. Conversely, support is discernible within the 148-149 range, representing a crucial demand zone from which a rebound is anticipated. In the short term, a target of approximately 173.50 is envisaged, coinciding with the anticipated rejection from this level. However, should this barrier be breached and maintained, the subsequent resistance level is anticipated around 187.50. Looking ahead, for a long-term perspective, the price may potentially test the previous high of 200, observed in December 2023.


