Buy Idea: Habib Bank Limited (HBL)📘 Buy Idea: Habib Bank Limited (HBL)
🔹 Timeframe: Monthly | Strategy: Structure + Type 1.4 + Context Targets
✅ Entry Zone:
Buy between 145 – 155 PKR (near the marked "M Type 1.4" level).
📉 Stop Loss (SL):
Below 92 PKR
("This low to be held as protected low" – the ITL zone).
🎯 Take-Profit Targets (TP):
Target Price (PKR) Gain % Description
TP1 240 ~60% First context target
TP2 314 ~120% Previous major high
TP3 411 ~165% Final potential rocket move 🚀
📌 Context & Narrative:
Price broke key structure levels and is forming a bullish base.
Multiple STL levels swept – shows smart money accumulation.
"M Type 1.4" indicates institutional interest.
Targets are based on historical price action and FVG-based projection.
💡 Position Strategy:
Buy 50% at current price (150–155)
Add 25% on a pullback to 140
Add 25% if price dips toward 130
HBL trade ideas

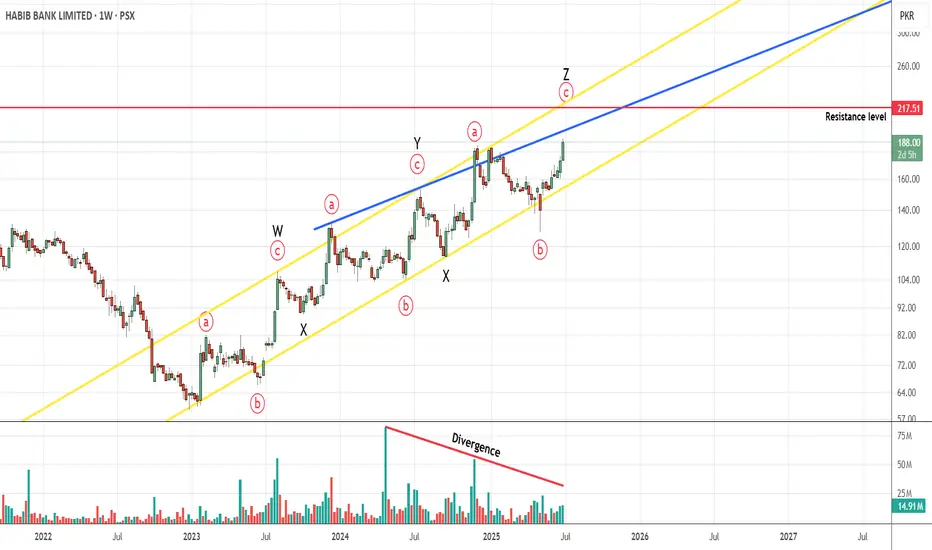
HBL PROBABLY IN WAVE '' C '' OF " Z " - LONGThis is in continuation of our HBL wave count/idea shared earlier.
HBL is most probably in wave C of Z which will take price up towards 214-217 range area, however prices can start declining after reaching the blue trendline at 196-200 level.
We will look forward to short sell HBL once price reach 214-217 level i.e. if the volume divergence remains intact. It is due to volume divergence that we are not marking our alternate impulse wave count, however volume divergence can be easily wiped out with prices forming a high volume bullish day until then we are sticking with our current wave count.
(Posting this with delay as we are already active in this trade at 185)
Trade setup:
Entry price: 185
Stop loss: 152
Targets:
T1: 196 - 200
T2: 214 - 217
Let see how this plays, Good Luck!
Disclaimer: The information presented in this wave analysis is intended solely for educational and informational purposes. It does not constitute financial or trading advice, nor should it be interpreted as a recommendation to buy or sell any securities.
HBL PROBABLY IN WAVE '' C '' OR " X " - SHORTThis is in continuation of our HBL wave count/idea shared earlier.
HBL is most probably in wave C or X which will take price down towards 127-122 range area,
prices are currently at a resistance level which has acted as a strong support previously therefore we are confident that it should hold and keep prices from climbing up.
We will short sell HBL once price break below 146.80 level and will target 133-130 range and further down 124-122 range, however prices might reach 160 before starting its decline. Alternately if prices break above 163 then this trade setup will get invalidated.
Although the risk/reward ratio is not that impressive but looking at the overall stock market momentum and geopolitical unrest, we have a little more confidence in this trade.
Trade setup:
Entry price: 146.80
Stop loss: 163
Targets:
T1: 133-130
T2: 124-122
Let see how this plays, Good Luck!
Disclaimer: The information presented in this wave analysis is intended solely for educational and informational purposes. It does not constitute financial or trading advice, nor should it be interpreted as a recommendation to buy or sell any securities.

HBL // BUYPump from Support
HBL one of the most successful banks in Pakistan, Good Fundamental + Support from Technicals

HBL- LONG TRADEHBL is currently in Phase C of Wyckoff Method, it has created spring which will be confirmed after it crosses 154.
Buying is recommended at that lvl and also after breakout and retest of phase D at 160

HBL PROBABLY IN WAVE 'A' OF CORRECTIVE PATTERN DOWNHBL is most probably in a corrective wave down which has started after a strong impulse wave up. Currently the market is in wave A of the corrective pattern downwards.
As a good practice one should always look into an alternate wave count, my alternate count
suggests that we are in a bigger WXYXZ corrective wave upwards and currently are in wave Y
which is almost complete and suggest price to move upwards.
My preferred wave count is ABC pattern down with a target price range around 122, We will
enter long positions around that range OR We will enter long positions once price break above blue resistance line of wave Y
Also in addition to our ABC wave count down a Double Top pattern has emerged, double top pattern has a high pullback percentage therefore anyone who wants to short sell the stock should wait for the price to break below the last swing low.
Remember volume is the key indicator here if the price does break the last swing low.
Let see how this plays, Good Luck !
Disclaimer: This is for informational purposes only; anyone taking trades using this idea will be liable for their own profit or loss.

HBL PSX IS STILL BULLISHHBL PSX appears bullish on both daily and 4-hour charts, suggesting a potential opportunity for prolific gain. HBL stock may be bullish in the short term. However, it is important to do your own research before making any investment decisions.

HBL FUTURETWM-1 (25/12/2024)
Buy HBL @145-150
Target 200+ in 3-4 weeks
No Stop loss
👏👏👏
HBL is bullish for midterm investment in 2025.
Lucky investors will be those who capture this price range (100-140) for the last time in the (FUTURE) history of HBL, around 2026.

HBL in bearish trendHBL is dropped from its support level of 169.69 and it is heading
to its stong support and psycological level of 130.
Fresh entry must be at above 170 level if it maintains.
TP 197 and 225.
If it wont maintin 170, wait for dropping to 130 levels.
If it maintain
on 130 take fresh entry, TP is 169, 197 & 225
Stop loss as per your strtegy.
Note: This is not a buy/sell call. Trade at your own will.

HBL could bouneback from 122.57 to 141.5 levelHBL is dropping and it could drop more to level of 122.57 and then it could bounceback to 141.5 level.
Note: This is not a buy/sell call, trade at your own will. Use strict Stop Loss.


HBL, Bullish channelBullish Channel
Moving towards top of channel
New highs expected
SL on break of channel bottom
Split entry at current price and 133 level
Target is top of channel i.e 165-170

HBL is all set to RIDE for a big moveHBL is all set to RIDE for a big move towards 170 price and/or above.
Condition: HBL must sustain above 120 even if hit SL

HBL - LONG is currently in a bearish trend on 1hour chart,
divergence was printed there's a possibility of reversal from this zone
long entry is recommended


HBL🚀 Stock Alert: *HBL*
📈 Investment View: Technically Bullish 📈
🔍 Quick Info:
📈 First Range : 116-116.50
🎯 First Target : 120.80
🎯 Second Target : 126.70
⚠ Stop Loss: 110
⏳ Nature of Trade: Short Term
📉 Risk Level: Medium
☪ Shariah Compliant: NO
💰 Dividend Paying: YES
📰 Technical View: Break out from descending trend line is observed. First and second resistance levels are 120.80 and 126.70 respectively. MACD show bullish momentum.


HBL is BulllishHBL is currently in a strong uptrend on weekly time frame. It is printing higher highs and higher lows, and according to AB=CD harmonics pattern, the projection says that there is still massive room for upward movement. Targets are mentioned on the chart.
P.S Analysis is conducted on weekly time frame, so this could take months to play out

PSX HBL analysis perfect target with Abcd/flaq patternPSX HBL analysis perfect target with Abcd/flaq pattern #hbl #psx

HBL-Bullish FlagHBL is forming a bullish flag patter which is continuation pattern.So we assume upward price movement when it will break 108 level.Upward price projection has been given

HBL - Bullish Flag HBL - Correction looks completed and the stock is anticipated to resume the uptrend. The breach beyond 102 will confirm the resumption of the uptrend. The predicted target lies within the 106 - 108 range, while the protective sell stop should be placed below 95.

HBL PSX Trend ContinuationThere is no notable divergence in RSI. can see making a bullish flag. which indicates a trend continuation of bearish trend.
