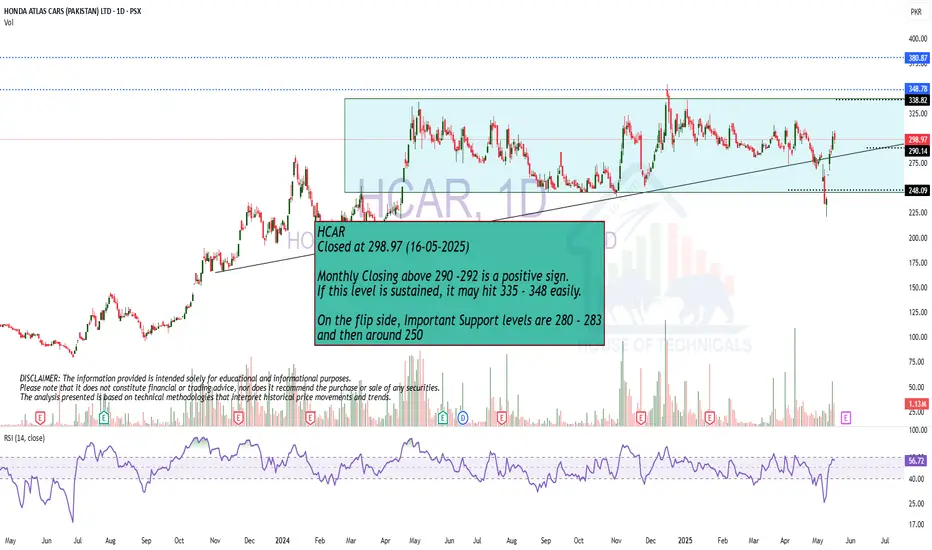
Play on Levels!
Monthly Closing above 290 -292 is a positive sign.
If this level is sustained, it may hit 335 - 348 easily.
On the flip side, Important Support levels are 280 - 283
and then around 250
HCAR trade ideas
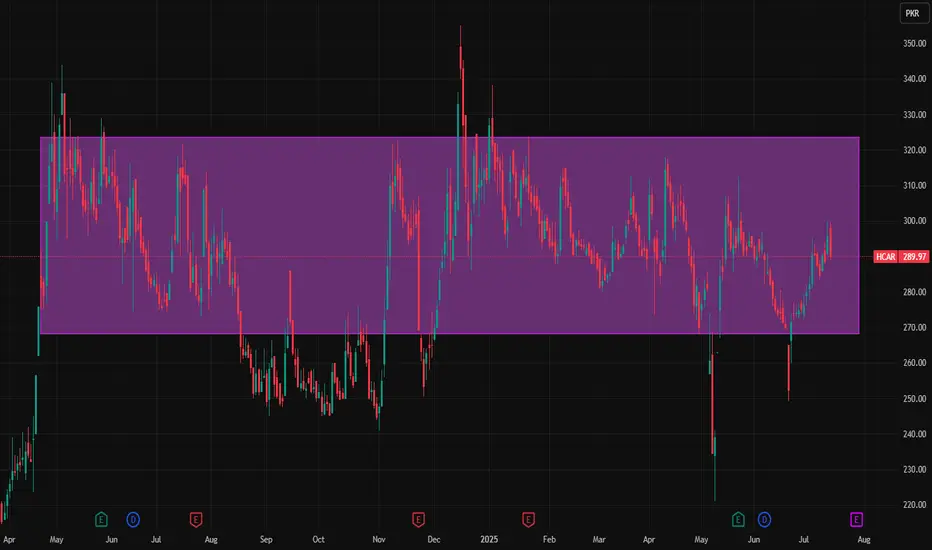
Hcar beltThis is Hcar daily chart and you can se the purple highlighted area is its belt of movement and mostly Hcar is moving between this area.
Note: This is not a buy/sell trade call. It is an analysis.
HCAR possible buying monthly Charton monthly analysis HCAR will be bullish. this is not any buying call do your own research before taking any decision.

HCAR buying strategyHere's a concise summary of your HCAR buying strategy:
HCAR Buying Strategy:
- Current Price: Rs. 294
- Buying Range: Rs. 290-284
- Targets:
- 1st Target: Rs. 312
- 2nd Target: Rs. 337
- Stop Loss: Rs. 280
Let's monitor the stock's performance and adjust the strategy as needed.

HCAR LONG TRADEHCAR has been in Bearish Channel which actually acts as Bull Flag.
It went below the channel in false breakdown to facilitate Selling Climax which is transfer of possession from Weak Hands ( Individuals ) to Strong Hands ( Institutions ).
This process and its components are actually a fuel for future uptrend.
Low Wave volume during Selling Climax/ Bear Trap are signs of Fake Breakdown to influence weak hands to sell their shares so that institutions have ownership during uptrend
BUY HCAR 290-300
TP1 320
TP2 340
SL BELOW 280

HCAR ANALYSIS- BUY CALL 13/4/2513/4/25
TF 3H/1D
PH C in prog
IBR(Ideal Buying Range) WAS ON SPRG BD 280-290
Next IBR after BO from channel at 340
and retest btw 325-340
SL below 280
TP 355 & 380

HCAR Stock Buying Strategy HCAR Buying Opportunity:
Key Levels:
1. Current price: 314
2. Buy zone: Below 300
3. Stop loss: 282
4. Targets: 324, 338, and final target 348
Strategy:
1. Buy on weakness: Enter the trade if the price dips below 300.
2. Risk management: Set a stop loss at 282.
3. Profit targets: Aim for 324, 338, and 348.
Considerations:
1. Market conditions: Monitor market trends and news.
2. Risk tolerance: Adjust position size according to risk appetite.
This strategy is based on the provided information. Always conduct your own research and consider consulting a financial advisor before making investment decisions.

Hcar is above green clouds (Strong bullish zone)Hcar is now above green sky (Strong bullish zone). It is expected to cross 350 and 400 level.
Note: This is not a buy or sell call, trade at your own will. Use stop loss as per your strategy.

Weekly Closing above 290 - 291 is very positive.Weekly Closing above 290 - 291 is very positive.
Monthly Closing should not go below 263.
284 - 298 is actually a Very Strong Support.
Resistance as of now is around 340 and then 360.

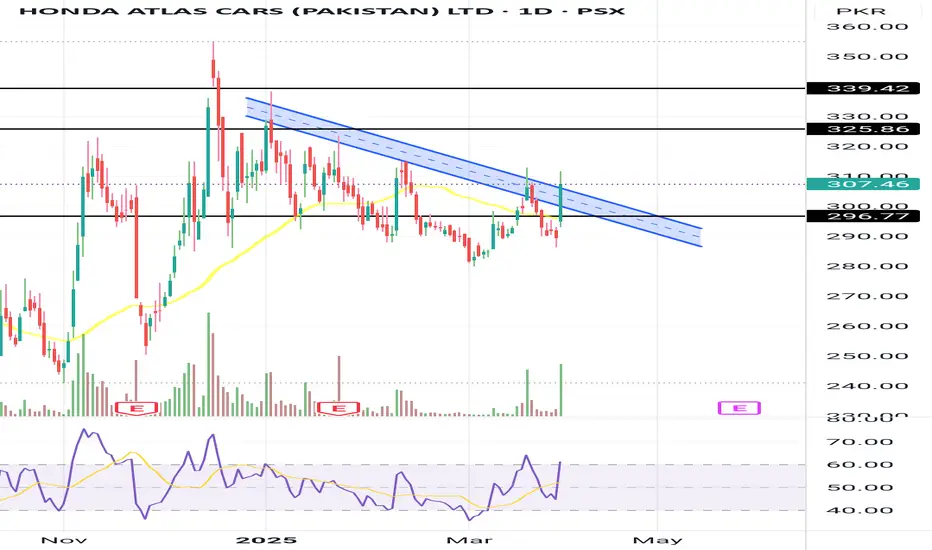
HCAR - BUYING OPPORTUNITY Buying Opportunity - HCAR
Buy Range: 297-307 (buying on weakness)
Stop Loss: 294
Target 1: 325
Target 2: 339
Further Action:
Hold if the stock sustains above 340.
Buy HCARHCAR after completing its Elliott Wave cycle in December 2023 has gone into complex correction. First phase of correction completed with type ABC Irregular Failure following all rules both price and time-wise. Now it is forming its second phase of correction with contracting triangle. It has fulfilled its criteria for formation of e-wave. It can start its trending move any time at the levels 289-278. However, there are also chances that e-wave may go further into formation of another small triangle. In that case, this small triangle will be formed without affecting price level to the down-side. It is matter of time only that HCAR may start its upward move towards 417. BUY @ cmp is recommended.

Monthly TF:
Cup & Handle Formation on Bigger TF.
Strong Support is around 263 - 265
Monthly Closing above 312 - 313 would be
a positive trigger.
Upside Target can be around 400 - 405
once 360 - 365 is Crossed & Sustained.
Ultimate Target can be around 640 - 650
from Short to Medium Term.
However, it should not break 240 otherwise
we may expect Huge Selling Pressure.

HCAR - LongThe auto sector as a whole has seen movement, but HCAR has yet to perform, primarily due to the lack of new product launches, making it less competitive against peers. However, sales for the January–March quarter have shown a significant increase , which is expected to reflect positively in profitability.
From a technical perspective, the stock needs to close above 312 with a strong green candle to gain momentum. All target levels are marked on the chart.
Please conduct your own research before making any investment decisions.

HCAR Way ForwardRespecting its trend line, HCAR can take a correction till 266.
Its Next targets can be 558 once it breaches its recent high of 355.
Short term resistance areas are 298, 311, 328 and 355.
Support areas are 285 and 266. Stop loss 244.

Hidden Bullish Divergence on Shorter Time Frame.Check out the levels for HCAR of all time frames from Monthly, Weekly to Daily.
Hidden Bullish Divergence on Shorter Time Frame.

HCAR Weekly AnalysisHCAR is near weekly trend line support , buy attempt can be taken around 280 with stoploss of below 240, reward is much high than risk. TP1@400 and TP 2@600

HcarHcar down from 338 and retraced about 40 days. Then it broke the retracement line but could not sustain. This break out became the fakeout.
So it can go further down upto 263 Trendline level because it broke the Ultra high volume lower breakout.

HCAR | Expected 100 Rupee Gain!Take a look at what we have here! I believe we can all agree that this chart is quite intriguing.
HCAR is showing bullish momentum after an uptrend making higher highs and higher lows pattern. The price is currently retesting for establishing its low. A possible pullback might be expected in its price action.
We’re likely to see a new bullish wave towards 400 level which is almost 33% gain but I believe there’s potential for significantly more growth in the months ahead.
Thank you so much for your continued support. Let’s ride this bullish wave together!

KSE 100 - HCAR - long or short?HCAR is currently in a strong bullish trend, with no signs of a reversal yet. The price is still showing upward momentum, and the trend remains intact. At the current level, it presents a good buying opportunity.
Entry: Buy at the current price level.
Stop Loss: Set at 263 to manage risk.
Take Profit: Target 398, with potential further movement towards 400, where the AB=CD pattern completes and aligns with a key resistance level.
The AB=CD pattern completion at 400 suggests that this area may act as resistance, so it’s critical to watch price action closely as it approaches this level. However, the overall trend is still bullish, and as long as the price remains above the 263 support level, the upward momentum should continue.

HCAR - Long PositionABCD can be followed. Medium term target is Rs.500.
Short-term targets are given on the chart.

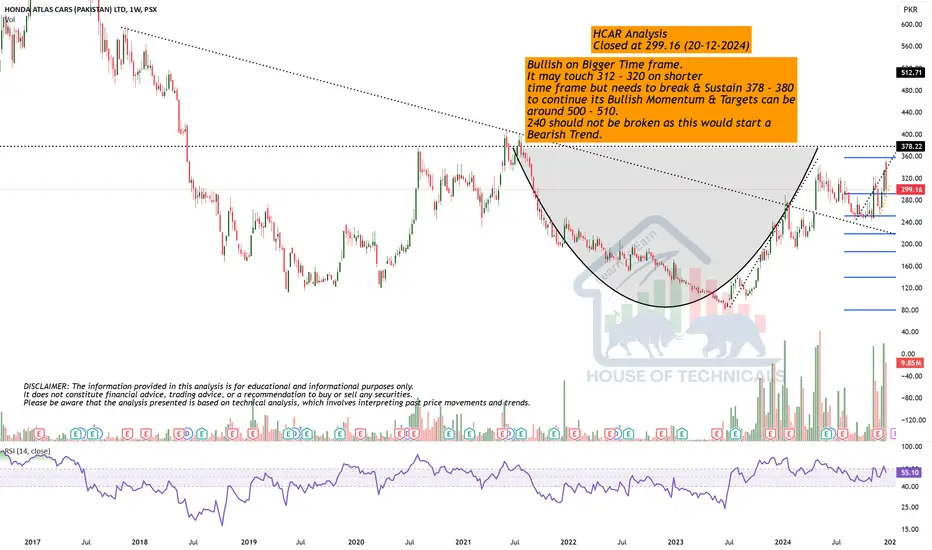
Bullish on Bigger Time frame.Bullish on Bigger Time frame.
It may touch 312 - 320 on shorter
time frame but needs to break & Sustain 378 - 380
to continue its Bullish Momentum & Targets can be
around 500 - 510.
240 should not be broken as this would start a
Bearish Trend.
HCAR ABCD Pattern: Breakout Buy SetupHCAR has broken its weekly resistance and is trading above it. An ABCD pattern is clearly visible on the chart. A buy can be considered if the daily candle closes above the resistance level.

HCAR has a potential to post 160% gain within next 12 monthsCritical point to watch is Rs. 410 which was a monthly LH, Monthly closing above 410 will trigger the journey towards the historical HH of 928, however, as per falling wedge pattern, the projected price would be around 848 which is a 166% gain from these levels. However, Stop loss should be placed at 243
