HCAR 286 breakout level to fly HCAR broken 268 resistance level and now moving to breakout 286 level, After 286 its next move will be to 308 and 340 levels.
Note: This is not a buy/sell call, Use Stop loss whenever trade.
HCAR trade ideas


Can HCAR will touch again 280 level after support of 241Current Financial results and after EX HCAR is above strong support level of 241 and currently it is trading on 248. These both conditions are favorable for its next level of 281.
Note: This is not buy/ sell call.

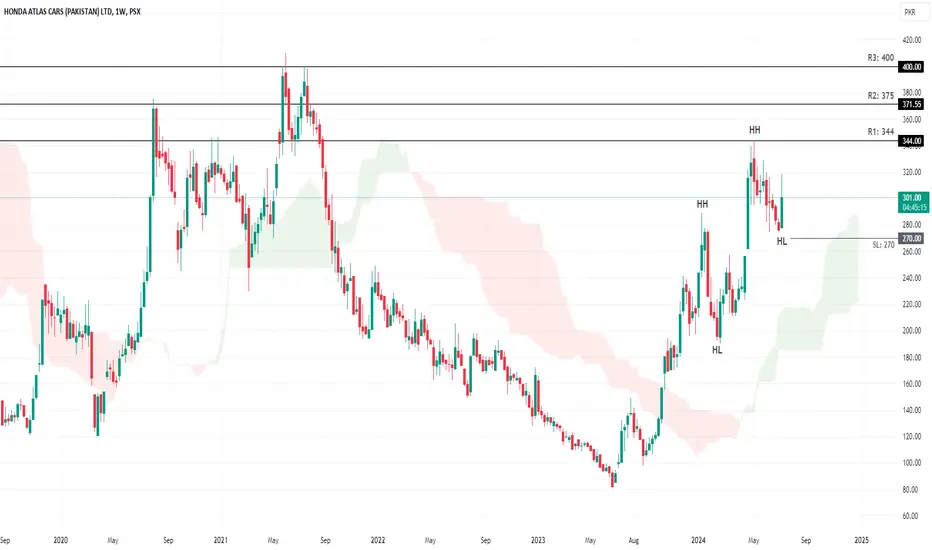
HCAR (Weekly)Upon analyzing HCAR on a weekly time frame, it is observed that the price has been establishing a pattern of higher highs and higher lows. Additionally, the moving average lines have recently crossed over, suggesting a bullish momentum in the market. Presently, the price has formed a higher low at 274 and retraced subsequent to establishing this support level. A prudent strategy would be to consider placing a stop loss below this support level, approximately around 270, to manage risk in the event of a break.
Key resistance levels are identified at 344 (R1), 375 (R2), and 400 (R3). These levels may act as barriers to further upward movement in the price of HCAR.
HCAR🚀 Stock Alert: HCAR
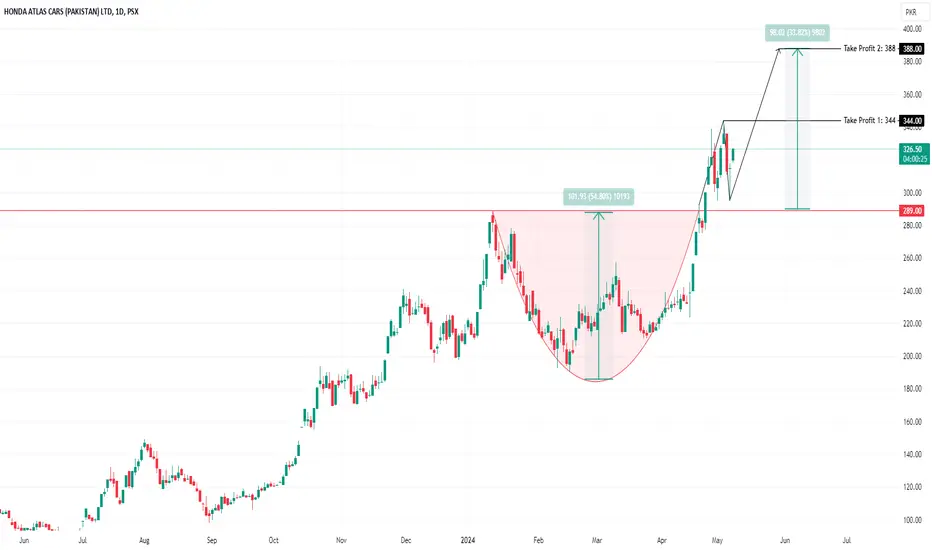
📈 Investment View: Technically Bullish 📈
🔍 Quick Info:
📈 Buying Range : 320-330
🎯 First Target : 344
🎯 Second Target : 388
⚠ Stop Loss: 288
⏳ Nature of Trade: Mid Term
📉 Risk Level: Medium
☪ Shariah Compliant: YES
💰 Dividend Paying: NO
📰 Technical View: The price action is currently pulling back after the break out from its previous resistance now acting as support around 289 and currently trading around 325. Long position can be consider for the target of 344 where double top formation will made and upon surpassing next target will be around 388. Use stop loss below 288 if the support breaks.
Buy HCARIncreasing volume which shows buyers are in control.
Price breaking monthly channel with good volumes.
Retest will confirm the bullish move.
TP 1 = Rs 400
TP 2 = Rs 850
It's is a long term trade so be patient with it.

PSX: HCAR starting the new phase of journey.HCAR, an auto manufacturer listed at PSX registered some hefty gains and subsequently printed a bullish flag. It is suggested we may initiate a long position when the price close above the channel i.e. 317. As per harmonic pattern the TP shall be 417.
Wishing you Profitable Trading

HCAR ANALYSIS 2.0HCAR forms a bearish reversal pattern along with the bearish divergence + a bearish flag is formed too.
Our Neckline , HL is broken and short sellers can instant sell.
target and Stoploss marked.

AB-CD Bullish Reversal PatternHCAR offering a nice multi-trade option on the AB-CD reversal pattern.

HCAR/PSXAn inverse head and shoulders pattern is a technical analysis pattern commonly used by traders to identify potential bullish reversals in the price of an asset. It consists of three troughs with the middle trough (the head) being lower than the other two (the shoulders), resembling the shape of a head and shoulders flipped upside down.
Here's how it typically forms:
1. **Left Shoulder:** The price of the asset declines to a certain level, then bounces back up, forming the left shoulder.
2. **Head:** After the left shoulder, the price drops further, forming a lower low. However, this decline is followed by a sharp increase in price, forming the head of the pattern. The low point of the head is usually lower than that of the left shoulder.
3. **Right Shoulder:** Following the formation of the head, there is another decline in price, but not as low as the head. This is followed by a rise in price, forming the right shoulder. The high point of the right shoulder is typically lower than that of the left shoulder.
The neckline is a trendline drawn connecting the highs of the left and right shoulders. Once the price breaks above this neckline, it's considered a bullish signal, indicating a potential upward trend reversal.
Traders often look for accompanying volume patterns to confirm the validity of the breakout. If the volume increases as the price breaks above the neckline, it adds further credibility to the pattern.
However, it's important to note that no pattern guarantees future price movements, and traders often use additional indicators and analysis to confirm their trading decisions.

last 2 Hourly candles is Tweezer BottomThose who think they have missed the rally, wait
for the re-test of breakout level around 288 - 290.
Sustaining 290 will lead it to 358 - 369 initially.
However, last 2 Hourly candles is Tweezer Bottom;
another hope for Upside; and if it Crosses 340, next
target would be around 360 - 369.
Stock is Bullish on All Time Frames but Bearish
Divergences are also appearing on Weekly TF, so Trade wisely.

HCAR (analysis).Hcar is forming a bullish flag pattern
rsi is synchronized with the price but adx and di+ are falling along with that bollingers are contracting too so if the price goes ABv 325 buy it with sl below 300 and 339 initial targets and 365 main targets.

HcarHcar rsi bearish divergence and now synchronized, now there is a bullish flag pattern with an entry at the price of 339 and sl at 315.

HCAR parallel channelHCAR can continue its parallel channel. Continuation till 172 is possible if the price action acts bullish in the market

HCAR The stock is currently in an uptrend making higher highs and higher lows and gives closing at 315.71. Initial resistance lies around 340 upon surpassing this level potentially driving the stock towards the next resistance level of 370. On the flip side, support is defined in a range of 287-290. Any dip to these levels could be viewed as a buying opportunity. Use stop loss if the price closes below 240.

HCAR (ANALYSIS) FOR SHORT SWING.
🚀 Stock Market Update 📈
HCAR Analysis:
Recent Performance: HCAR has recently hit 256, achieving all targets.
Current Outlook:
RSI: Extremely bullish.
Bollinger Bands: Expanding, signaling a bullish trend continuation.
Trade Recommendation:
Action: Buy HCAR at current rates.
Target: Sell at 272-275.
Stop Loss: Below 252, closing basis only.
Happy trading! 🌟

HCAR (Intrady / swing)Hcar trading in bullish Trend.buy/support range 230-232,
238-241 selling range if crosses then next trade will open at 242 for targets of 253-255.
Sl below at 225 closing basis.

HCAR- support and resistanceThis chart portrays the accumulation phase, so with support and resistance technique, it is time to take entry.

Bullish ABCD Pattern will play?If 190 is Broken, Bullish ABCD Pattern will
be in play with Target around 170

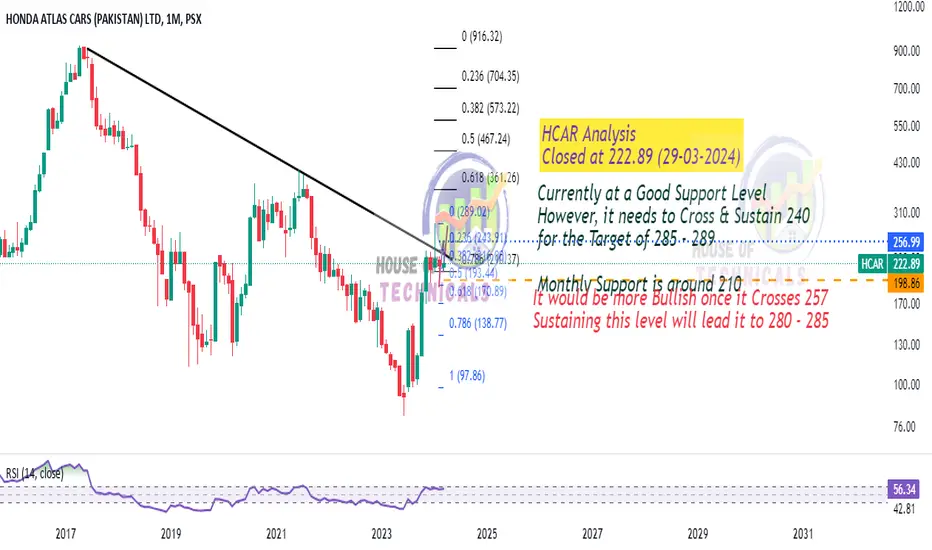
Monthly Support is around 210Currently at a Good Support Level
However, it needs to Cross & Sustain 240
for the Target of 285 - 289
📈 HCAR | Might be surprising!The price action has been consistently demonstrating rejection over the course of the past three consecutive days. Anticipation of a pullback is warranted from the support level of 200, which also signifies a crucial test of its ascending trend line. Positioned as a significant barrier, the resistance level rests at 240; a breach of this level may herald further upward momentum, while failure to surpass it may result in continued rejection. A prudent risk management strategy entails implementing a stop loss below 190, triggered by the breach of the trend line and support level.

