HINO – LONG TRADE (SECOND STRIKE) | 12 JULY 2025HINO – LONG TRADE (SECOND STRIKE) | 12 JULY 2025
The stock is in an uptrend supported by a trend line (dotted blue). After a corrective leg in a bearish channel (light pink), the stock showed signs of breakout and reversal. Our previous call achieved all targets, and after a minor correction, the stock appears primed for another uptrend leg.
HINO trade ideas

HINO LongHino broke its downward channel line in November 24. It posted a high of 545 in Jan 25 and came back to retest the level which broke the downward channel (~300).
Now it is exactly at its Fib 0.236 level, crossing which, it will pace up and move towards its next levels.
Next levels are: 545, 589, 721 and 853 in short to medium term.
Long terms target can be its all-time high level of 1274.
Its not a buy / sell call, just my personal opinion.
Daily, weekly and Monthly RSI are all at or around 60 that show positive momentum.
Moreover, the increasing volumes since it broke downward channel showing active players ;)
One thing to note that its free float is very low, that will cause its very fast move upward (whenever it may be)

HINO--- A High Probability BUY SwingTradePrice is currently at a High Probability Buy Zone with Target at 544 & 600. Confluences include:
1. BB-50 (Base line Retest and Rejection) on weekly TF.
2. RBS Zone overlapping with 61.80% to 78.6% Fib. zone.
3.Strong MACD Signal.
4. Surge in Volume on Daily TF at a key support area.
5. SL below 322

HINO potential Buy setupReasons for bullish bias:
- DOW theory, Entry at HL
- Price took support at Fib Golden zone
- Overall, a bullish trend
Here are the recommended trading levels:
Buy 1(CMP): 416.87
Buy 2: 345
Stop Loss Level: Closing below 271
Take Profit Level 1: 502
Take Profit Level 2: Open
if price gives closing above 508, the next resistance (next target) will be till 675! Happy trading

Refrain from trading in HINOAfter making Bearish divergence on daily time frame. the stock is likely to restest its breakout trendline and hopefully consolidate in 336-340 range for another bull ride.

PSX - KSE100 - HINO - end of bullish trend?HINO has successfully broken out of both the falling trendline and an accumulation box, signaling a bullish trend. Currently, the price has tested the Fibonacci golden pocket and formed a hammer candle, which is a bullish indicator.
Trading Plan:
Buy Opportunity:
Entry: Current price
Stop Loss: Below the hammer candle low at 380
Targets:
TP1: 490
TP2: 525
Re-entry Plan (if Stop Loss is Hit):
Entry Zone: 360-325
Stop Loss: Below 310

HINO - PSX - Technical Analysis - CRAB Harmonic PatternHINO is in bull run since 26 Nov 2024. On daily TF, RSI does not show any sign of divergence and KVO is almost vertical suggesting a strong bull run. However, RSI is almost at 85 and at any time trend may retrace to define a proper Higher High.
Resistance Zone 481~530 is critical. Then another resistance line at 700 is present.
On weekly time frame, Crab Harmonic pattern has been drawn, which if respected by price then we will see a very substantial return at TP-4 in 15 months time.
Trade Values
Buy-1 (Mkt): 435
TP-1: 481 (people will sell to book profit around 465)
Buy 2 : 425 (on retracement)
TP-2: 481~ 530 (people will sell at a bit higher values than TP-1)
TP-3: 700 (A small retracement is possible due to profit booking)
TP4: 1630 (For Swing Trading)
Stop Loss: 277 (Kindly modify Stop Loss, as TP-2 is hit to make breakeven for Swing trading).

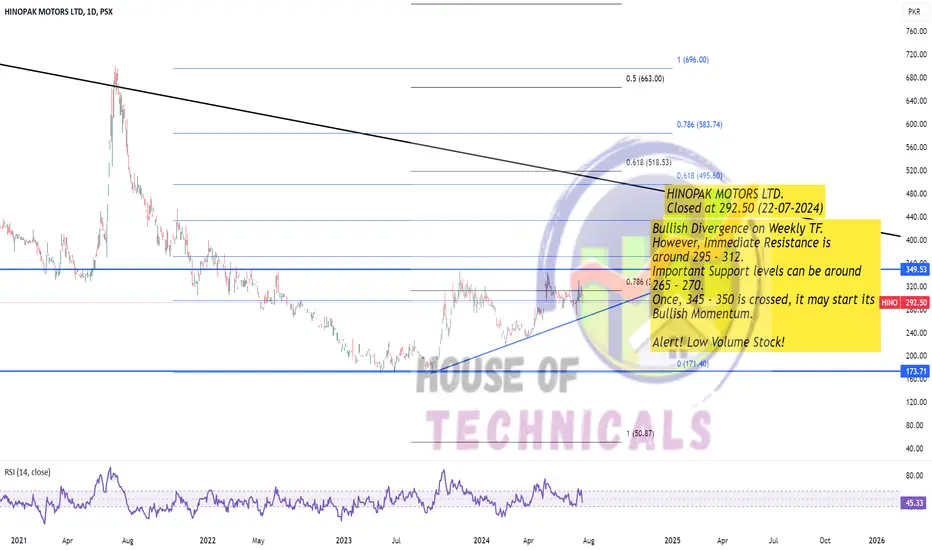
Bullish Divergence on Weekly TF.
However, Immediate Resistance is
around 295 - 312.
Important Support levels can be around
265 - 270.
Once, 345 - 350 is crossed, it may start its
Bullish Momentum.
Alert! Low Volume Stock!
HINO:- RISE IN THE MAKINGHINO has been sideways since November 2023. The candle formed in the last week shows the battle among the Bulls & Bears has been intensified. The odds are in favour of Bulls. The buying zone is from 292 to 320. Close above 320 shall trigger the breakout and the price may go beyound TP2.
SL in this case is 260.
Have a profitable trading.

PSX: HINO Mark the Cherry to pick it laterHINO, a security from Auto sector, defined the bottom a year ago since than it is trying to let itself loose to gravitate towords north. Its first attempt in the last quarter of year 2023 could not sustain yet it gave the bulls hope to muster their power again. Albeit it has not crossed the previous high but the weekly closings suggest that it may retrace to the Fib. levels of 0.5 & 0.618 i.e. Rs. 288, 275, respectively and these prices could be used as smart entry points. If price brake low the Stop Loss than we may get out of position.
For TP the resistance level has been used on the chart, which are Rs.348 & 399.99
Wishing you a profitable trading.
