Medium to Long Term View.HUBC Analysis
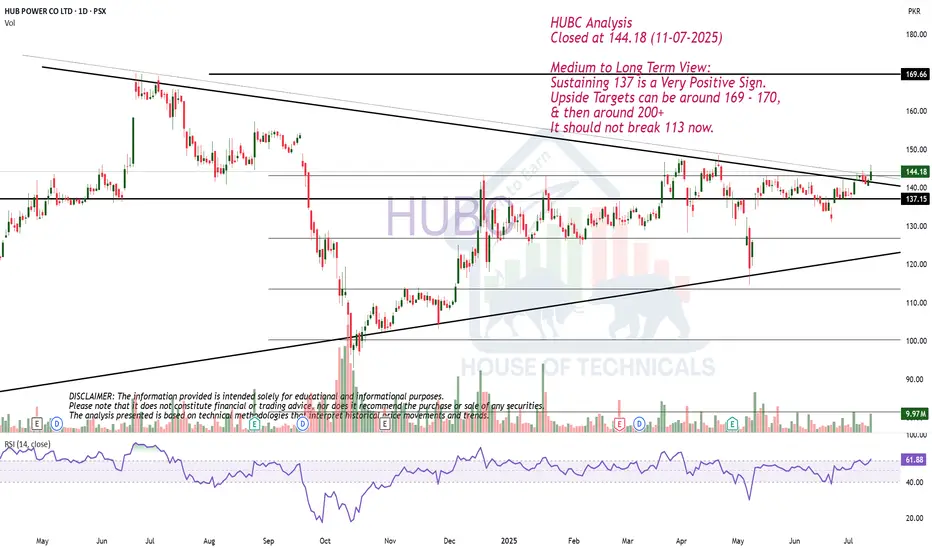
Closed at 144.18 (11-07-2025)
Medium to Long Term View:
Sustaining 137 is a Very Positive Sign.
Upside Targets can be around 169 - 170,
& then around 200+
It should not break 113 now.
HUBC trade ideas
Bullish on Bigger tf.HUBC Analysis
Closed at 142.07 (04-07-2025)
Bullish on Bigger tf.
Immediate Resistance is around 142 - 145.
Crossing & Sustaining 154 - 55 may lead it
towards 200+

HUBC ANALYSIS- LONG TRADEHUBC has successfully tested its 1D trendline, it's continuing its bullish momentum.
Buying Range 136-142
TP1 147
TP2 157
LONG TERM TP 164
SL BELOW 130

HUBC SHORT TRADEHUBC has completed its TOPPING FORMATION and has broken down with shifting of heavier volumes on bearish side as shown by Weis Wave Volumes
SHORT HUBC 127-135
TP 111
SL 141

Though Bullish but..
Though Bullish but Bearish Divergence has appeared
on bigger TF.
ABCD Pattern intac but only if 155 is Crossed & Sustained
with Good Volumes.
Upside Targets can be 200+
Good Support levels are 136 - 138 and then around 123 - 125

Bullish Momentum
Closing above Trendline around 133 - 134
would keep it Bullish.
Upside targets can be around 150-160.
However, breaking 131 will bring more
selling pressure towards 113 - 115.

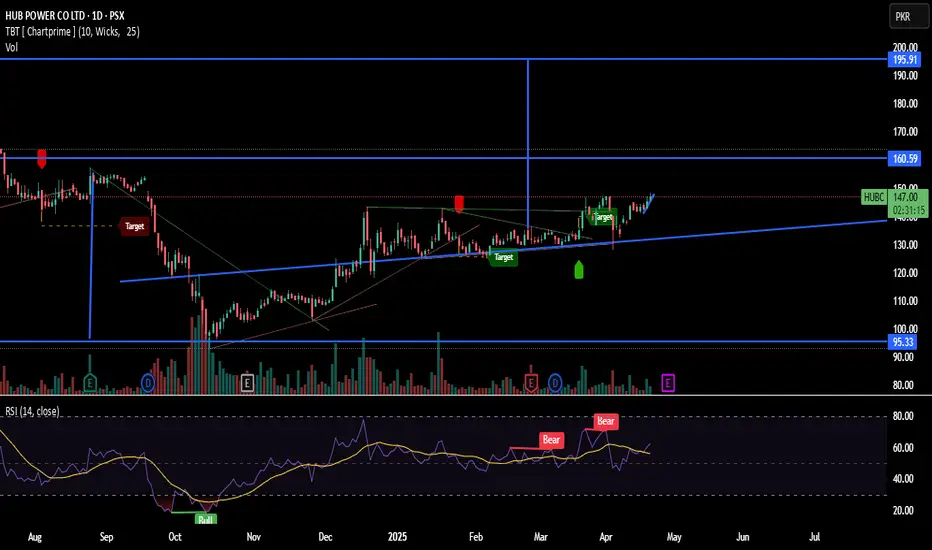
HUB POWER CO LTD (PSX: HUBC LONG IDEATargets:
160.59 PKR — This is the first key resistance level and a clear target, where the price might face selling pressure.
195.91 PKR — Major upper target or longer-term resistance zone, if the momentum continues.
💪 Supports:
95.33 PKR — Strong historical support, price has bounced from this level before.
Around 135-138 PKR — This area, marked by the blue trendline, is acting as dynamic support as the price respects the upward trend.
📊 RSI Insight:
RSI is at 62.38, which is heading toward the overbought zone but still has room for upside.
Watch for an RSI break above 70 for overbought or below 50 for potential weakness.
The chart shows a bullish breakout above minor resistance, approaching 147 PKR now. If it sustains above this, 160.59 looks like the next pit stop.
Bullish on Bigger Time Frames.Bullish on Bigger Time Frames.
but Important Resistance area is around 145 - 148.
Crossing this rangewith Good Volumes will expose
the levels around 170 & then 190.
132 & 125 are important Support levels as of now.

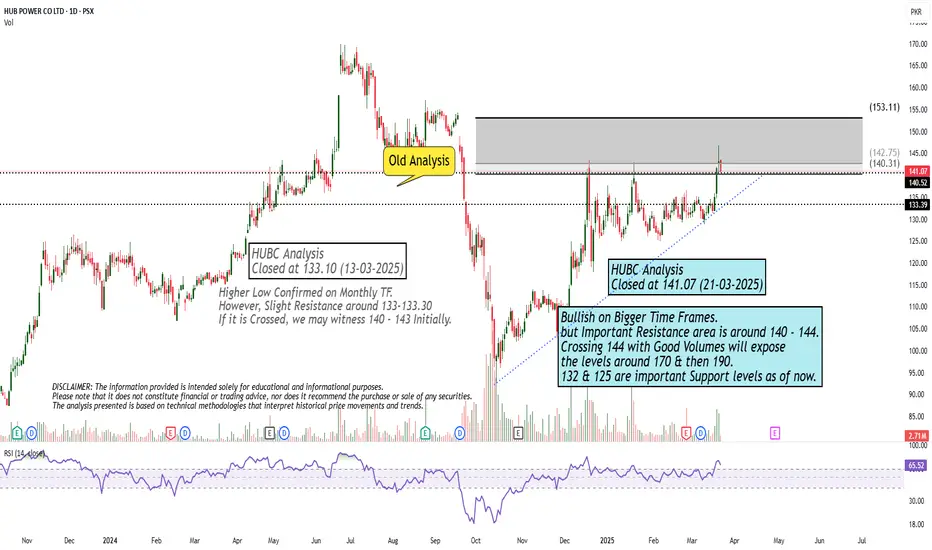
Bullish on Bigger Time Frames.Bullish on Bigger Time Frames.
but Important Resistance area is around 140 - 144.
Crossing 144 with Good Volumes will expose
the levels around 170 & then 190.
132 & 125 are important Support levels as of now.
Govt. to Clear HUBCO’s Pending Payments Within 90 DaysBullish Breakout: Price has cleared a key resistance zone at 144-46 PKR, signaling an upward trend.
Buying Momentum: As long as the price stays above the trendline, the bullish trend remains intact.
Overbought : Currently stock at Overbought zone, A short-term pullback and consolidation is due before another rally.


HUB POWER CO LTD (HUBC) on the Pakistan Stock Exchange (PSX)HUB POWER CO LTD (HUBC) on the Pakistan Stock Exchange (PSX). Here’s a breakdown of key observations:
1. Price Action & Trendlines
The stock appears to have broken out of a long-term downward trendline.
The breakout level seems to be around 134-135 PKR, which is currently being tested.
There is a potential inverse head and shoulders pattern, indicating a possible trend reversal.
The target projection post-breakout is 195.91 PKR, suggesting a bullish move.
2. Volume Analysis
There is a noticeable increase in volume, supporting the breakout.
A sustained volume increase would confirm the breakout's strength.
3. RSI Indicator (Relative Strength Index)
The RSI is at 58.27, indicating bullish momentum but still below the overbought zone (70+).
If RSI continues to rise, it may signal further upward movement.
4. Support & Resistance Levels
Support: 130-134 PKR (Breakout Zone)
Resistance: 195.91 PKR (Target)
5. Overall Sentiment
Bullish breakout confirmed with volume and trendline break.
Watch for a retest of 130-134 PKR. If it holds, the stock may continue upward.
Confirmation of a rally towards 195.91 PKR will depend on sustained buying pressure.

HUBCThe Cup and Handle is a bullish continuation pattern in technical analysis. It consists of:
1. Cup:A rounded bottom forming after a price decline, signaling accumulation.
2. Handle:A small consolidation or pullback following the cup’s peak.
3. Breakout: Price breaks above the handle’s resistance, often with high volume.
Target Price:
The expected move equals the depth of the cup added to the breakout point.
It’s a strong signal in up trending markets, especially on longer time frames. 🚀

HUBC, 1Dlook like complete the fourth wave and target price 160 which is completed 5th wave
This analysis is for informational purposes only and should not be considered investment advice. Always conduct your own research and consult with a financial professional before making any investment decisions.

HUBC IS BULLISH IN & AFTER 2025HUBC IS BULLISH IN & AFTER 2025
2025 targets.
HUBC should be accumulated at current prices or if it retraces back in coming months (Q2-2025).
It may hit ~275 by the end of 2025 or in Q12026.
DISCLAIMER:
The information provided doesn't guarantee results. 𝙏𝙧𝙖𝙙𝙞𝙣𝙜 𝙞𝙣 𝙛𝙞𝙣𝙖𝙣𝙘𝙞𝙖𝙡 𝙢𝙖𝙧𝙠𝙚𝙩𝙨 𝙘𝙖𝙧𝙧𝙞𝙚𝙨 𝙧𝙞𝙨𝙠𝙨. Individuals should perform a thorough analysis and consider their risk tolerance before making investment decisions. 𝙄 𝙖𝙢 𝙣𝙤𝙩 𝙧𝙚𝙨𝙥𝙤𝙣𝙨𝙞𝙗𝙡𝙚 𝙛𝙤𝙧 𝙛𝙞𝙣𝙖𝙣𝙘𝙞𝙖𝙡 𝙡𝙤𝙨𝙨𝙚𝙨 𝙧𝙚𝙨𝙪𝙡𝙩𝙞𝙣𝙜 𝙛𝙧𝙤𝙢 𝙖𝙘𝙩𝙞𝙤𝙣𝙨 𝙗𝙖𝙨𝙚𝙙 𝙤𝙣 𝙩𝙝𝙞𝙨 𝙥𝙤𝙨𝙩. Consult with a qualified financial advisor before entering to trade in stocks.

HUBCDescription: The upper trendline is flat, while the lower trendline slopes upward.
Implication: This pattern suggests bullish continuation, where the price is likely to break above the flat upper trendline.
Buyers are getting stronger, as evident from higher lows.
Resistance at a certain level creates a horizontal line.

HUBC offers 35% gainTrade can be entered at 158 by placing SL @ 103 for a TP of 213.
The stock went into bearish trend as soon it broke out the HL around 141, thereafter it consistently posted new LHs and LLs. However, RSI made double bottom instead of making LLs, which indicated the potential reversal of trend.
If 158 being its LH is broken, the stock will be ready to again making new HHs and HLs.

HUBC offers over 60% gain within next 12 monthsLong term Investors or long term swing traders should enter the stock's trade.
Cup and Handle formation on the monthly chart is in making
Monthly closing above 140.41 will expose the stock to post Historical Highest price around 224
SL should be placed below 93
TP1 could be placed at 189 by entering the trade at 141 while TP2 could be set at 237, while as per projections, Trade could be closed at 224

HUBC is good to buyHUBC showing increase in its revenue. P/E is good. Momentum is little bit less. Bullish Engulfing candle in Green rectangle is showing Buying zone. It is good to buy.

HUBC -PSX - Technical AnalysisHUBC on Daily TF is going bullish. RSI momentum indicates a steady rise and hence prices are going up. KVO also is suggesting that trend is going upwards but still the real Bull run has not begin. Weekly channel has been drawn. Once, this weekly channel is broken upwards then the real bull run will kick-in.
Therefore, sensible trade plan will be to now (Buy-1) and then exist (TP-1) at upper weekly resistance line. Then if the price breaks the resistance, buy again (Buy-2).
Butterfly Harmonic pattern has also been drawn which if respected by the price, then the weekly upper resistance line will not be broken. In that case price will drop to point C where a new buy can be initiated (BUY-3).
LONG (Buy) Call
Buy-1 : 118.20
SL 1: 102
TP-1: 137.00
Buy-2 : 140
SL 2 : 135
TP-2: 165.00
BUY-3: 103
SL 3: 93
TP-3: 165

Long HUBCI would have bought 104.21 as its a monthly OB. But I was late so I will wait now for it to come back to an other OB below at 86.53 if it comes. I will wait for it then long at my price. No rush. Entry, SL and Exit all there. Manage your risk! #DYOR
I will update if it ever comes and fill my price. Will wait and see. Remember all my trades are spot no leverage. I buy shares and keep it.

HUBC is poised to make recovery and enter into bullish trendThe stock has recently broke its previous HH at 114 with heavy volumes and now poised to make another HH
Instant entry can be made here with SL of Rs. 103, with first TP of 127 and second TP of 140. Offering ~18% potential gains from these levels.
The stock has also made symmetrical triangle and broke out recently which further confirms its reversal pattern, however, the final projection of the symmetrical triangle would be Rs. 133.
Based on symmetrical pattern, the stock is still offering roughly about ~13%

HUBC Bullish ReversalHUBC , bullish divergence is spotted on daily chart, depicting a potential trend reversal pattern. wait for the entry level, target price is indicated on chart.
