Watch for the Support Level119 - 120 may act as an Important Support.
It touched 120.22 on Friday.
However, Closing above 131 is Important to
Sustain.
Sustaining 131 may lead it towards 138 - 139
HUBC trade ideas

HUBC : 1H BULLISH REVERSAL PATTERNHUBC : Divergence between Price and RSI on Hourly chart depicting a probability of potential Bullish Reversal setup.

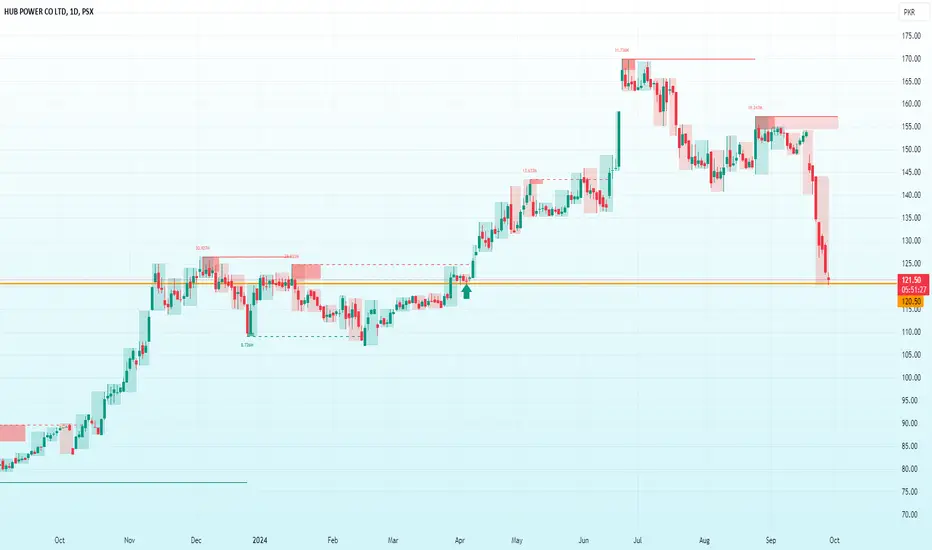
HUBCThis chart shows the price movement of HUB Power Company Limited (HUBC). The stock reached a peak price of approximately 170 PKR in late June 2024 but has experienced a significant decline since then, currently trading around 121.75 PKR. The recent sell-off appears strong, with a sharp drop over the past few weeks. The stock is nearing a support level around 120.50 PKR, which was last touched in late 2023. Volume spikes (highlighted) indicate heavy trading during key price changes.

HUBCThis chart shows the price movement of HUB Power Company Limited (HUBC) stock on the Pakistan Stock Exchange (PSX). The stock reached a peak price of approximately 170 PKR in late June 2024 but has experienced a significant decline since then, currently trading around 121.75 PKR. The recent sell-off appears strong, with a sharp drop over the past few weeks. The stock is nearing a support level around 120.50 PKR, which was last touched in late 2023. Volume spikes (highlighted) indicate heavy trading during key price changes.
HUBC - Hub Power Company Ltd, Weekly TF , AnalysisHUBCO - On weekly candles chart, is posting very large red candle so far. Such huge candle indicates dumping in big numbers. I'm inclined to refrain from buying till it touches Buy2 price close to 113. If it crosses key support level, then I'm out by initiating Sell through Stop Loss. Then I'll wait to buy it once it touches yellow lines.
I also add that RSI momentum indicator indicates Bears are in control and still there is further room to go bearish.
TPs have been set at key levels where market tend to book profit after which is small dip is always seen.
LONG Buy Call
Buy 1 : 120.34
Buy 2 : 113.82
SL: 104.41
TP1: 155.00
TP2: 165.00
TP3: 185.00

HUBC -PSX - LONG Buy CallHUBCO is retracing and it may bounce back from its support level is at 126.45 .
On Weekly time frame it is also evident that selling is on for booking profits by big fishes. Since market sentiments are also a bit negative, therefore, chances are that it will test support level of 109 as well.
So first Buy Call at 126.45 to 127 will fetch very good returns. And if price still falls then next support level is at 109.55. Second Buy at that price is even better.
On Daily time frame RSI momentum indicator suggest that momentum is on Selling side and since there is no RSI divergence yet, therefore, Buy 2 is quite possible at 109.5 zone.
Expected gains are almost 70% on NAV value and if we add expected earnings and dividends then even 100% is possible.

HUBC----- buying near 126-----132The Hub Power Company Limited was incorporated in Pakistan on August 1, 1991 as a public limited company. The principal activities of the Company are to develop, own, operate and maintain power stations. The Company owns an oil-fired power station of 1,200 MW (net) in Balochistan (Hub plant).
Fundatmental analysis
HUBCO have book value of 161 now its trading under its book value and its latest earning per share is Earnings
Latest EPS Upto 2024 4Q Rs. 53.98
EPS Last Quarter 2024 4Q Rs. 15.78
Dividend: 85% annonce on 18 september
COGR last 5 years CAGR 19.94% Growth/Year
technical
Trend is making higher high and higher low now trend came to Fib 0.6 level and 50 ema and monthly resistance now more chances of trend goes in bullish

HUBC best buy - Advance Analysis - 23 September 2024In my analysis
wait till price 134 to 133
if its turn back from this then buy other wise it will dorp more
so wait and hold dont buy in hurry

Eye Keypoints for Potential Reversal (Technicals + Fundamentals)In the past several weeks, we've observed the following market movements:
1. First Uptrend: Over 23 weeks (161 days), the price increased from around 64 to 124 with a substantial volume of 438.94M.
2. First Downtrend: Following this, the price declined over 11 weeks (77 days) from 124 to 108, with a volume of 237.994M.
3. Second Uptrend: The price then rebounded over 18 weeks (126 days) from 107 to 168, supported by a volume of 319.661M.
Currently, we are in the 11th week of the latest downtrend, where the price has decreased from 168 to around 140, with a volume of 282.442M.
Key Insights:
The current downtrend mirrors the previous downtrend in duration (11 weeks) and volume.
The proximity of the current volume to past downtrends suggests we may be nearing a reversal point.
If historical patterns hold, we might anticipate a potential price rebound beginning within the next week or two.
Next Steps:
Monitor for an increase in volume (towards the 300M+ range) to confirm a reversal signal.
Target a potential price high of around 200 to complete this cycle if the upward trend resumes.
Furthermore , if we expect a dividend of 30 Rs next year and the expected interest rate is 15% , then the target price based on the dividend can also be calculated as follows:
Target Price = Expected Next Year Dividend / Expected Next Year Interest Rate
Target Price = 30 / 0.15 = 200 Rs
Conclusion:
While the current short-term trend is bearish (11 bars area), the increased volume hints at a possible reversal soon. With a projected dividend of 30 Rs next year and an expected interest rate of 15%, the target price based on dividends would be 200 Rs. This fundamental target supports the technical signals suggesting potential upward movement. Proper risk management and self-study should be incorporated.

LongBullish on Weekly as well as Monthly TF.
Last Month, it tested its very important
support level around 140 - 142 & reversed.
Now 148 - 150 can be retest for next upside move.
However, 140 should not be broken.

HUBCHUBC currently trading in a parallel channel with the closing above 50-day SMA on the daily chart. The stock is in uptrend. MACD is showing a bullish signal, trading above its signal line. Initial support lies around 147 while resistance level defines around 157.

Hubco Down Trend Analysis - 16th to 20th SeptemberHubco Down Trend Analysis
Warning: If selling pressure continues to push the price below $0.23, avoid buying.
Best Buy Area: The ideal buying zone is above $0.5.
Validity: This analysis is my personal view and is valid until September 20th, 2024.
Feedback Welcome: If you're reading this after the validity period, feel free to test the analysis and share your feedback. Your input is appreciated!

PSX HUBC Range broken- 152 level breached
- Price has broken out of range with heavy volumes.
- In uptrend, new higher high formed.
- Bullish MACD

HUBC - BullishLarger Trend: Bullish
Smaller Trend: Bearish to Bullish
Range: In lower range
Anticipation Scenerios:
1. If price breaks Choch again buy and stoploss at previous LL.
2. If price tested buy demand again buy and stoploss at below buy zone
TP should be 1:1.5


HUBC Monthly chart :longHUBCO has broken the high made in Feb 2017 of 140.40 in May 2024
135.88 to 140.40 is the support area which will be the entry point
Target price will be 224
Stop loss is 107
This is a monthly chart , might need to hold for a year as an investment
Profit Percentage: 224-146= 78/146 = 53%

HUBCFor PSX lover..
HUBCO is looking rock solid to buy . 200 EMA support and rest of aggressive breakout level.

HUBC Trend line SupportIn daily time frame HUBC moving up from its trend line support , 150 is good rate to buy

HUBC - Short Sell and then Buy after booking Profit.HUBCO is retracing and it may bounce back from its bullish trend line at around 143. However, if trend line is broken then its next support level is at 127 . On Weekly time frame it is also evident that selling is on for booking profits by big fishes.
So one can enjoy double ride i.e. Short Sell at 142 and Take Profit at around 130.
Then Buy at 127 and TP at appropriate level will fetch very good returns.

Retest PossibleRetest of Monthly Breakout around 140-143
possible.
It is safe as long as it stays above 135 - 136.

Retest PossibleRetest of Monthly Breakout around 140-143
possible.
It is safe as long as it stays above 135 - 136.

HUBC🚀 Stock Alert: HUBC
📈 Investment View: Technically Bullish 📈
🔍 Quick Info:
📈 Entry Range: 115
🎯 Targets : 130
⚠ Stop Loss: 110
⏳ Nature of Trade: Short Term (Scalping)
📉 Risk Level: Medium
☪ Shariah Compliant: YES
💰 Dividend Paying: YES
📰 Technical View: Establishing bullish momentum. Can test ascending trend line around 130. Stop loss can be placed below 110.

HUBC - ShortHUBC is currently in uptrend
but there is a bearish divergence printed on 7th may 24
there's a chance of reversal from here
short entry is recommended after the breakdown of
131.24 with sl of 144 and tp 118.48
