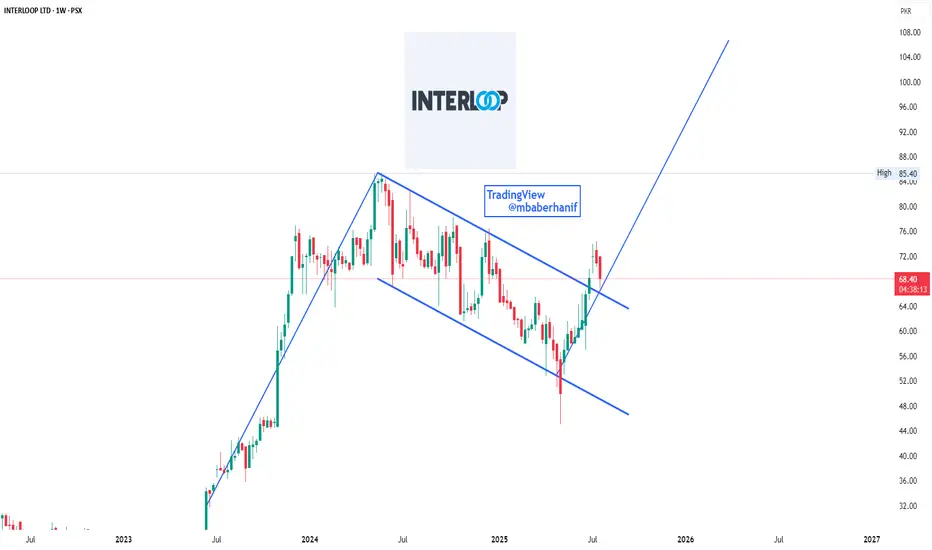
Bullish Flag Breakout on ILP – Next Rally LoadingILP displays a classic bullish flag pattern, typically seen as a continuation signal in technical analysis. After a strong upward rally (the flagpole), the stock entered a downward sloping consolidation channel (the flag). Recently, it has broken out of this pattern, indicating a potential resumptio
Next report date
—
Report period
—
EPS estimate
—
Revenue estimate
—
3.87 PKR
16.51 B PKR
158.18 B PKR
277.67 M
About INTERLOOP LTD
Sector
Industry
CEO
Navid Fazil
Website
Headquarters
Faisalabad
Founded
1992
ISIN
PK0114501015
FIGI
BBG00NTFXGC9
Interloop Ltd. engages in the manufacture of hosiery products. It offers a range of socks with various quality levels and price points in line with all types of customers including brands, retailers, and specialty stores; and yarns for denim, hosiery, and weaving industry. The firm operates through the following segments: Hosiery, Spinning, Denim, Energy, Apparel, and Others. The Hosiery segment focuses on the sale of socks and tights. The Spinning segment is involved in sale of yarns and its in-house use. The Denim segment sells denim products and garments. The Energy segment relates to the generation of electricity for in-house consumption. The Apparel segment relates to the sale of fashion apparels. The Others segment includes sales, yarn dyeing denim and active wear. The company was founded by Musadaq Zulqarnain, Navid Fazil, and Tariq Rashid Malik on April 24, 1992 is headquartered in Faisalabad, Pakistan.
Related stocks

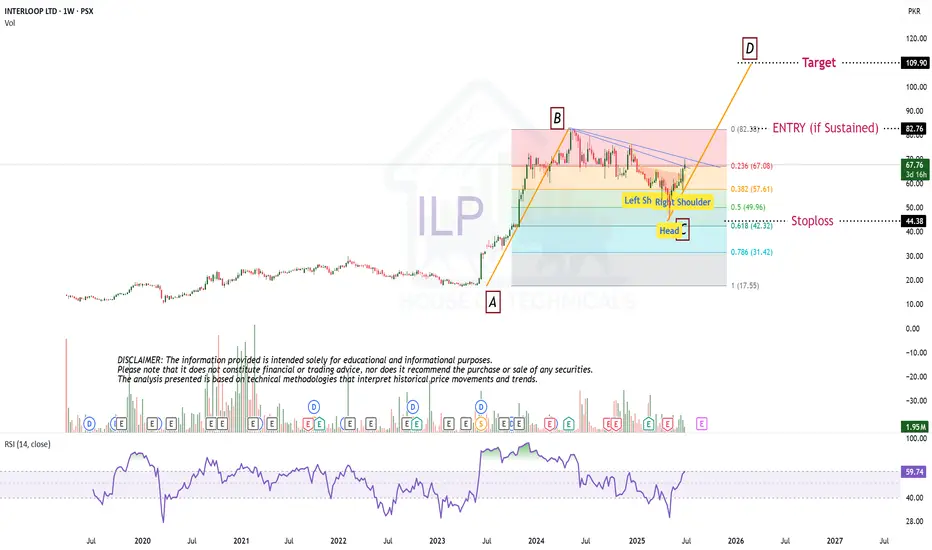
ILP is BullishPrice was in a strong downtrend, however the breakout of the daily descending trendline and printing of a higher high hints the control of bulls. If freshly printed HH is broken with good volume then we can expect a bullish rally as per Dow theory. Targets are mentioned on the chart.

Play on levelsILP Analysis
Closed at 60.04 (20-05-2025)
Immediate Resistance is around 60.
However, Weekly Closing above 58-59
would be a positive sign.
Upside, it has the potential to touch 64 - 65
& then 67 - 68.

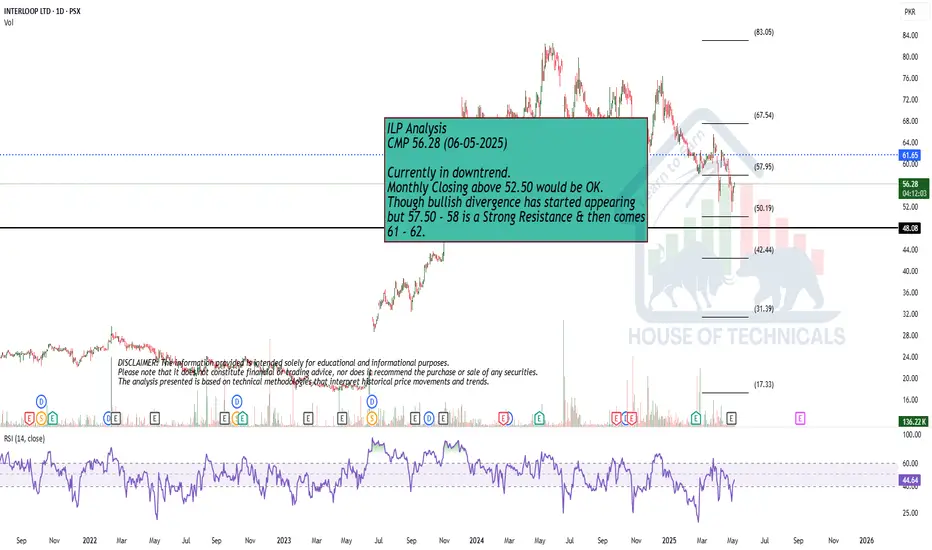
Currently in downtrend.Currently in downtrend.
Monthly Closing above 52.50 would be OK.
Though bullish divergence has started appearing
but 57.50 - 58 is a Strong Resistance & then comes
61 - 62.
Interloop - ILP: Potential Bullish The chart for Interloop Limited (ILP) shows the stock currently trading within a downward-sloping channel, with clear support at 59.14 (marked by the yellow line) and resistance at 61.42. The price has been consistently testing the lower boundary of this channel, and the support level at 59.14 has h


BEST BUY AT 45 LEVEL AFTER Q3 2025 RESULStill the buy is conditional, subject to good result in next quarter, Q3 2025.
Previous quarter result was not satisfactory so i myself adjusted my porftolfio.
ILP deserve rest and i put in my reserved player. Will look for a bullish signal in Apr-May 2025 after Quarter 3 result announcement.
It

Currently making LH LLs but..Weekly & Monthly Closing above 60.67 would be a Positive Sign.
Though currently making LH LLs, but
Bullish Divergence on Daily TF is another Positive Sign.
Upside levels can be around 65 - 67
However, in extreme pressure, it may touch around 53 - 55
& that would be an Important Support level.

See all ideas
Summarizing what the indicators are suggesting.
Neutral
SellBuy
Strong sellStrong buy
Strong sellSellNeutralBuyStrong buy
Neutral
SellBuy
Strong sellStrong buy
Strong sellSellNeutralBuyStrong buy
Neutral
SellBuy
Strong sellStrong buy
Strong sellSellNeutralBuyStrong buy
An aggregate view of professional's ratings.
Neutral
SellBuy
Strong sellStrong buy
Strong sellSellNeutralBuyStrong buy
Neutral
SellBuy
Strong sellStrong buy
Strong sellSellNeutralBuyStrong buy
Neutral
SellBuy
Strong sellStrong buy
Strong sellSellNeutralBuyStrong buy
Displays a symbol's price movements over previous years to identify recurring trends.
Frequently Asked Questions
The current price of ILP is 72.95 PKR — it has increased by 5.89% in the past 24 hours. Watch INTERLOOP LTD stock price performance more closely on the chart.
Depending on the exchange, the stock ticker may vary. For instance, on PSX exchange INTERLOOP LTD stocks are traded under the ticker ILP.
ILP stock has risen by 15.24% compared to the previous week, the month change is a 14.90% rise, over the last year INTERLOOP LTD has showed a −0.73% decrease.
We've gathered analysts' opinions on INTERLOOP LTD future price: according to them, ILP price has a max estimate of 104.00 PKR and a min estimate of 75.00 PKR. Watch ILP chart and read a more detailed INTERLOOP LTD stock forecast: see what analysts think of INTERLOOP LTD and suggest that you do with its stocks.
ILP stock is 9.82% volatile and has beta coefficient of 0.88. Track INTERLOOP LTD stock price on the chart and check out the list of the most volatile stocks — is INTERLOOP LTD there?
Today INTERLOOP LTD has the market capitalization of 109.68 B, it has increased by 1.67% over the last week.
Yes, you can track INTERLOOP LTD financials in yearly and quarterly reports right on TradingView.
INTERLOOP LTD is going to release the next earnings report on Sep 3, 2025. Keep track of upcoming events with our Earnings Calendar.
ILP net income for the last quarter is 1.47 B PKR, while the quarter before that showed 1.15 B PKR of net income which accounts for 27.92% change. Track more INTERLOOP LTD financial stats to get the full picture.
INTERLOOP LTD dividend yield was 6.35% in 2024, and payout ratio reached 38.20%. The year before the numbers were 11.34% and 27.79% correspondingly. See high-dividend stocks and find more opportunities for your portfolio.
As of Aug 1, 2025, the company has 34.92 K employees. See our rating of the largest employees — is INTERLOOP LTD on this list?
EBITDA measures a company's operating performance, its growth signifies an improvement in the efficiency of a company. INTERLOOP LTD EBITDA is 21.76 B PKR, and current EBITDA margin is 19.29%. See more stats in INTERLOOP LTD financial statements.
Like other stocks, ILP shares are traded on stock exchanges, e.g. Nasdaq, Nyse, Euronext, and the easiest way to buy them is through an online stock broker. To do this, you need to open an account and follow a broker's procedures, then start trading. You can trade INTERLOOP LTD stock right from TradingView charts — choose your broker and connect to your account.
Investing in stocks requires a comprehensive research: you should carefully study all the available data, e.g. company's financials, related news, and its technical analysis. So INTERLOOP LTD technincal analysis shows the buy rating today, and its 1 week rating is buy. Since market conditions are prone to changes, it's worth looking a bit further into the future — according to the 1 month rating INTERLOOP LTD stock shows the buy signal. See more of INTERLOOP LTD technicals for a more comprehensive analysis.
If you're still not sure, try looking for inspiration in our curated watchlists.
If you're still not sure, try looking for inspiration in our curated watchlists.