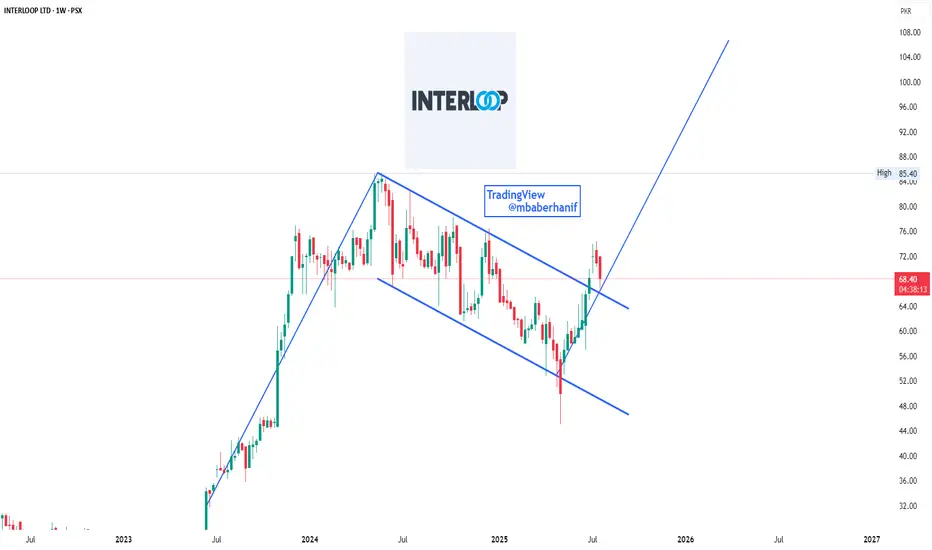
Bullish Flag Breakout on ILP – Next Rally LoadingILP displays a classic bullish flag pattern, typically seen as a continuation signal in technical analysis. After a strong upward rally (the flagpole), the stock entered a downward sloping consolidation channel (the flag). Recently, it has broken out of this pattern, indicating a potential resumption of the prior bullish trend. Although a pullback is currently in play, this retest of the breakout zone may offer a strong support base. If held, the stock could be poised for another impulsive move upward, targeting new highs in the coming months.
ILP trade ideas

ILP is BullishPrice was in a strong downtrend, however the breakout of the daily descending trendline and printing of a higher high hints the control of bulls. If freshly printed HH is broken with good volume then we can expect a bullish rally as per Dow theory. Targets are mentioned on the chart.

Play on levelsILP Analysis
Closed at 60.04 (20-05-2025)
Immediate Resistance is around 60.
However, Weekly Closing above 58-59
would be a positive sign.
Upside, it has the potential to touch 64 - 65
& then 67 - 68.

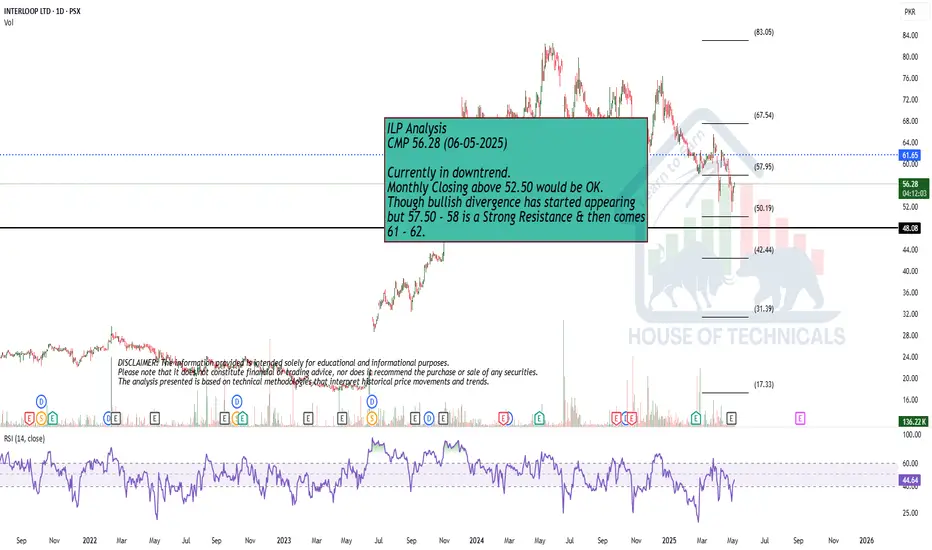
Currently in downtrend.Currently in downtrend.
Monthly Closing above 52.50 would be OK.
Though bullish divergence has started appearing
but 57.50 - 58 is a Strong Resistance & then comes
61 - 62.
Interloop - ILP: Potential Bullish The chart for Interloop Limited (ILP) shows the stock currently trading within a downward-sloping channel, with clear support at 59.14 (marked by the yellow line) and resistance at 61.42. The price has been consistently testing the lower boundary of this channel, and the support level at 59.14 has held in the past, indicating it could offer a potential bounce. If the stock manages to hold above this support, it could initiate an upward move.
A breakout above 61.42 would be a strong bullish signal, suggesting the stock could continue to rise towards the next resistance levels around 64.00 or higher. However, if the price fails to maintain support at 59.14, it could slide further down to 52.86, marking the next significant support level.
Overall, the stock is in a downtrend, but the current setup provides an opportunity for a potential reversal if it successfully breaks the resistance and holds above support.


BEST BUY AT 45 LEVEL AFTER Q3 2025 RESULStill the buy is conditional, subject to good result in next quarter, Q3 2025.
Previous quarter result was not satisfactory so i myself adjusted my porftolfio.
ILP deserve rest and i put in my reserved player. Will look for a bullish signal in Apr-May 2025 after Quarter 3 result announcement.
It has a good suppoer at 45 area.
If fall down then we are looking it at 28 area.
Its my potentional player for my portfolio but for now, ILP is not in my Best of 20 players for 2025.

Currently making LH LLs but..Weekly & Monthly Closing above 60.67 would be a Positive Sign.
Though currently making LH LLs, but
Bullish Divergence on Daily TF is another Positive Sign.
Upside levels can be around 65 - 67
However, in extreme pressure, it may touch around 53 - 55
& that would be an Important Support level.

Technically, Weekly candle close: Fundamentally, Better EPSWe need the two signals.
This week it touched the lower trenline of daily channel. yet no candlestick confirmation.
1st, candle stick pattern close on weekly basis.
2nd: Quaterly report is expected in next two weeks which will confirm the technical movement.
A positive report will boost the bullish sentiment to first @70 area and upon break the trenline resistance, it will move further to 100.... matlab century to marega..
A negative report will dump it and price may drop to its monthly fibb level at 60% around 45 area.
Lets' wait and see. I will think about the position next week upon weekly candlestick closure.

ILP - PSX- Buy OpportunityILP was in a small bearish phase previously, but it has made a bullish divergence at 1D that played well and is now taking support from a key support level. Look for buy at the current level and place SL below support.

INTERLOOP BULLISH FLAG PATTERN The script of Interloop (ILP) seems to continue the Bullish Trend as Bullish Divergence is seen on the charts and the price is bouncing from the 0.618 FIB level making Bullish Flag Pattern.
The target price for the Script is around Rs. 149 with major support at Rs. 85.
What are your Views ????????

ILP can be traded for 60% potential gainsILP trade can be entered into at a price above 85.5 with a SL of 60.5
First TP will be 110.5 while second TP would be 135.5, Final Projection of the Bullish pennant around is Rs. 140, a good company with solid capital potential on the cards.

ILP potential Buy setupReasons for bullish bias:
- Price formed double bottoms at strong support level
- Overall, a bullish trend on daily
- Bullish divergence
Here are the recommended trading levels:
Buy 1(CMP): 71.7
Buy 2: 67.2
Stop Loss Level: Closing below 61
Take Profit Level 1: 78
Take Profit Level 2: 85

ILP | End of H&S Pattern?Interloop (ILP)- Swing Trade Setup
Company Profile
Interloop is a leading vertically integrated textile manufacturer, producing high-quality hosiery, denim, knitted apparel, and seamless activewear for top global brands and retailers with a strong focus on ESG.
Trade Setup
Current Price PkR63.50
Entry Price PkR63
First Target PkR70
Second Target PkR75
Third Target PkR80
Stop Loss PkR54.50
Risk & Reward Ratio 2
PE Ratio 5.6 (below 6)
Analysis:
ILP declined after making Head & Shoulder patter and currently at its support level. Last two week candle shows sustaining in the price. Possible pull back is expected. It's entering a double bottom zone, which typically indicates a bullish reversal. Look for entry points in the designated buyback zone for a strategic trade.
Price Targets:
Expect an initial surge to around PkR70 and aim for a mid-term target of PkR75. Optimistically, the final setup target could hit PkR80.

ILP | Head & ShoulderILP showing a clear Head and Shoulders pattern, which is a common bearish reversal signal. The components of the pattern include:
Left Shoulder : The first peak that forms after an uptrend, followed by a pullback.
Head : The highest peak that follows the left shoulder, followed by another decline.
Right Shoulder : The final peak, lower than the head but similar to the left shoulder, indicating weakening upward momentum.
The pattern's Neckline is clearly drawn around the PKR 64 mark, and the price has broken below it, confirming the head and shoulders formation. The price recently fell significantly (down 11.66%), suggesting a potential move lower, as depicted by the projected trendline that points towards a support level around PKR 46.30.
The overall analysis points to a bearish outlook, with a likely further decline towards the mentioned support level, assuming no significant changes in market dynamics.

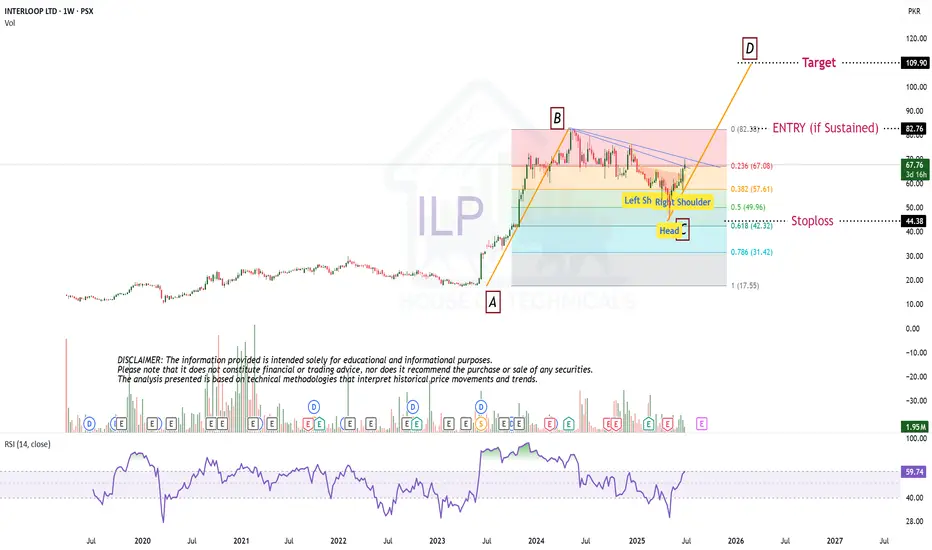
ILP | Head & ShoulderThe chart represents a head and shoulders pattern for Interloop Ltd. (ILP) on the Pakistan Stock Exchange (PSX). This technical analysis indicates a potential reversal in the stock's upward trend. The chart marks the "Left Shoulder," "Head," and "Right Shoulder" at the top of the price movement, forming the classic head and shoulders structure. The "Neckline," drawn horizontally, acts as a support level around PKR 63.91. The stock price has tested the neckline multiple times, and a breakdown below this level could indicate a further downward trend, possibly aligning with the projected blue arrow suggesting a significant price drop if the pattern completes.

Monthly Candle would be a Doji if it closes around 70.
However, stock is still Bullish on Monthly TF.
Bearish Divergence on Weekly TF has appeared.
But Yes, Closing above 68.40 - 68.50 would be a
positive trigger.
If this level is Sustained, we may witness 75 - 76
then 83 - 85.


Short on weekly time frameHuge volume on sell side. The price target would be 45 on the sell side. Looking forward to accumulating it in that area which is also it's fibb 60% area.

Sell InterloopBearish indicators (Strong)
1. RSI & MACD Divergence on weekly timeframe
2. Price is in uptrend but volume is declining.
3. Recently heavy selling pressure. (Tax)
4. BO of Rechtangle pattern will confirm trend reversal
5. Break of Rectangle and weekly support will active our setup.
Price Targets on the chart.
Bullish indicators (Weak)
1. RSI is trending upward.
2. Price Respected weekly support
