KAPCOTrend is Bulish price retracment at 0.618% Buying entry.
Entry price 31
Stop Loss 25
Target price 43
KAPCO trade ideas

KAPCO Stock Forecast: Buy or Sell? Key Levels to WatchCurrent Price Level: The stock is trading at PKR 32.85,
Potential Trading Strategy:
If the price holds above PKR 32.40, a short-term recovery toward PKR 33.68 and 35.68 .
A break above PKR 35.96 may signal a strong uptrend toward PKR 37.99.
Caution : breaks below PKR 30.5, it may fall to the next support at PKR 27.35
Risk-Reward Calculation:
Entry Stop-Loss Target (TP1) Target (TP2) Target (TP3)
30.00 28.00 (-2.00) 34.86 (+4.86) 35.96 (+5.96) 37.99 (+7.99)
Disclaimer: The views and analysis in this article are opinions of author and are for Informational purposes only.

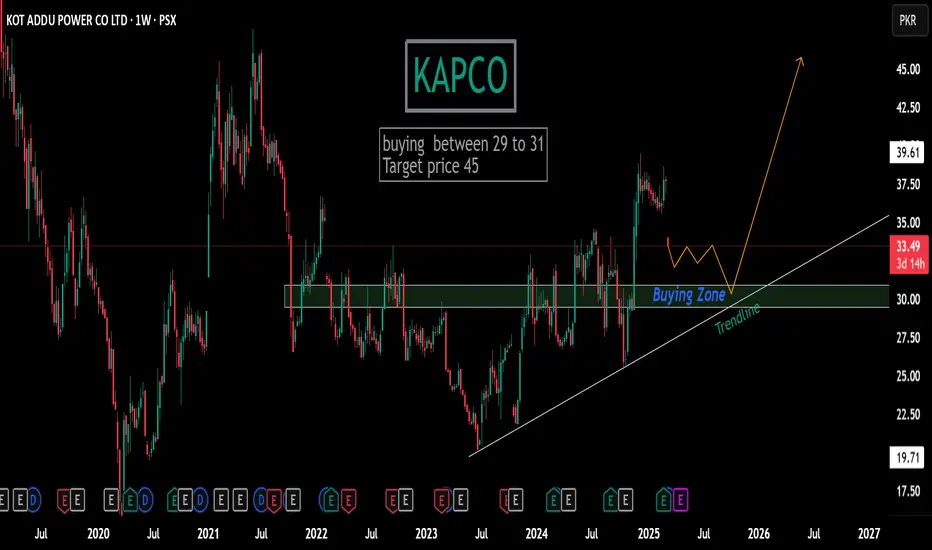
KAPCOinvestment base Trade.
Bulish trendline
after XD price retrac at support zone with test bulish trendline .
buying 29 to 31
Target price : 45 :
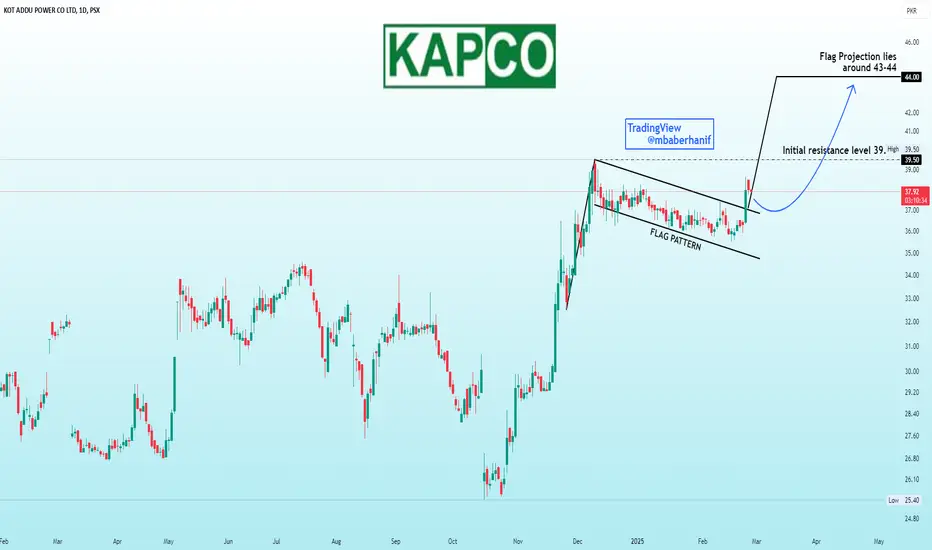
KAPCO – Bullish Flag Pattern Breakout in PlayKAPCO is forming a bullish flag pattern, indicating a strong uptrend continuation. The stock is currently consolidating within the flag, and a break above 39.50 with strong volume would confirm the breakout, potentially leading to a rally towards 42-43. This level also marks a double top resistance, where some short-term rejection could be expected. However, if the breakout sustains with increased buying pressure, it could pave the way for further upside. Traders should monitor volume closely for confirmation before entering a position.

KAPCO - Flag PatternThe stock displays a bullish flag pattern on strong volume, trading confidently above both the 20 and 200-day EMAs, suggesting robust upward momentum. Previous session shows a break out of the flag and price closed +2.45% above it. Initial resistance lies around 39.50 which is the formation of double top pattern from where short term rejection can be seen. However, a decisive break above the resistance level will confirm the continuation of the bullish trend and flag projection lies around 43-44.
KAPCOmonthly analysis of kapco.
this trade is long time hold .
Bulish divergence then beark last LH .print 1st HH.
also reversal patren head and shoulder and beark the neckline ,
Anticipate price goning up and print 2nd HH with projection of head and shoulder target.
Target is 50.


KAPCO | Bearish Pennant PatternIf the price breaks lower trend line then Bearish Pennant Pattern confirms and more down side can be seen in upcoming sessions.

KAPCO is A DIAMOND FOR LONGTERM INVESTMENTSKAPCO is A DIAMOND FOR LONGTERM INVESTMENTS
KAPCO seems bullish from a long way of bearish movements since 2015 after hitting its ATH @99.
After successful recovery from 20 after hitting bottom @14.5, now it seems to rush towards its upper targets between 50-60 in midterm timeframe and around 150 in long-term targets.
This view is solemnly "OUR VIEW" and no one is advised or suggested to do trading or investments on basis of "OUR" analysis.
For any type of investments follow our rule
"NO CLAIM NO BLAME, NFA 'n' DYOR"
GUIDLINES: Red zone are our selling zones and green zones are our accumulation zones.
Good luck
Team TRADERSWORLD.

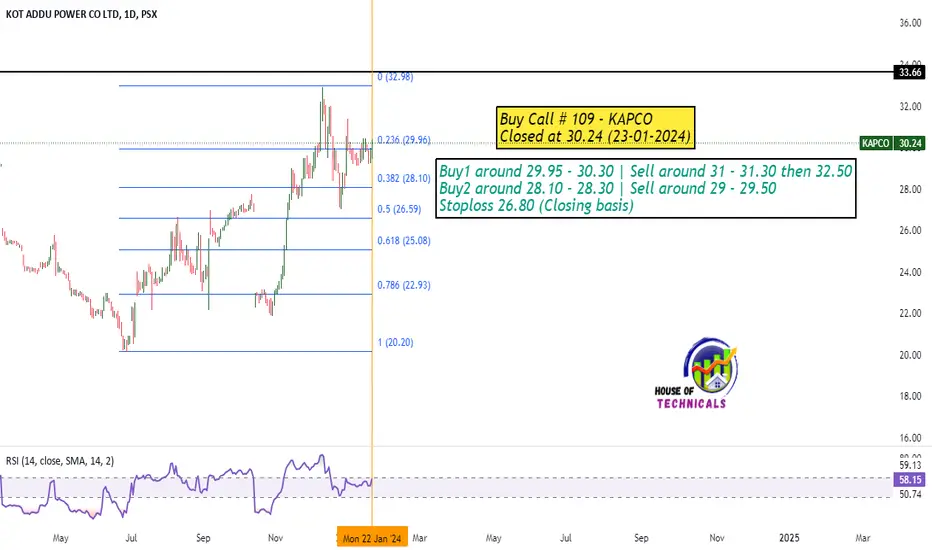
KAPCOBuy1 around 29.95 - 30.30 | Sell around 31 - 31.30 then 32.50
Buy2 around 28.10 - 28.30 | Sell around 29 - 29.50
Stoploss 26.80 (Closing basis)

KAPCO - Bearish ChannelKAPCO is currently trading within a bearish channel, however, it is anticipated that the upward trend will persist. It is anticipated that the price will test the upper channel resistance line in the near future.

KAPCO Hourly - BEARISH CHANNEL PULLBACKKAPCO has tested the bottom channel support at 23.52 and the price has closed below the lower Bollinger Band, suggesting a potential short-term pullback. It appears that KAPCO is currently experiencing a downturn in price. Traders and investors should closely monitor the price action and consider adjusting their strategies accordingly.
