KSE 100 Technical Analysis | 01 AUGUST 2025 (corrected)KSE 100 Technical Analysis | 01 AUGUST 2025
The KSE 100 index is moving in a textbook bullish pattern, having recently completed a trading range marked by a horizontal channel in light blue. This pattern has provided a strong base for the index's renewed uptrend. We expect the index to be more stabl
Related indices

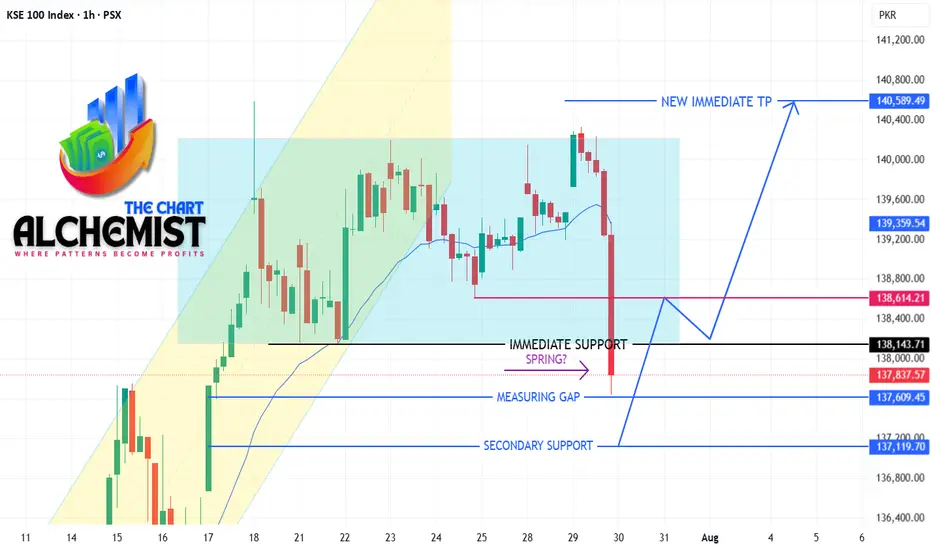
KSE100 Technical Analysis 29-07-2025KSE100 Technical Analysis (1H Time Frame) 29-07-2025
The index displayed heavy selling pressure in the last two hours, with big bearish candles. However, it touched a bullish measuring gap at 137600 and showed a small sign of upward reversal.
Key Observations
- Expected reversal from the current le
KSE 100 Index Analysis The KSE 100 | 04-08-2025KSE 100 Index Analysis | 04-08-2025
The KSE 100 index is behaving as predicted. Today's session has unlocked a new immediate target of 144,900. The index is heading towards the intermediate target of 142,840. The ultimate target remains 151,600 before any major pullbacks. We maintain our stance that

KSE 100 Technical Analysis 01-08-2025KSE 100 Technical Analysis | 01-08-2025
The KSE 100 index has formed a trading range between 136000 and 140200. After breaching the previous resistance at 13900, the index retested this level in the final hour of trading. We expect the index to rise from this level, cross the upper limit of the trad

KSE-100 INDEX TECHNICAL ANALYSIS | 31 JULY 2025 KSE-100 INDEX TECHNICAL ANALYSIS | 31 JULY 2025
The KSE-100 Index has established a trading range between 136,000 and 140,200. After breaching the previous resistance at 139,000, the index successfully retested this level during the final hour of trading. This behavior suggests a likely continuation

KSE-100 INDEX TECHNICAL ANALYSIS | 28 JULY 2025KSE-100 INDEX TECHNICAL ANALYSIS | 28 JULY 2025
The KSE-100 index has completed its pullback by trading above the bearish pullback channel (marked light below). It is now taking support from the trend line (dotted blue color line) and facing resistance from the inclined resistance line (dotted red

KSE 100 Index Technical Analysis 26-07-2025📈 KSE 100 Index Technical Analysis 26-07-2025
The KSE 100 index is moving in an uptrend, albeit at a relatively slowed pace. Although it broke down from the upward channel (marked yellow color), it filled the measuring gap, marked a higher low, and completed its pullback. The index seems poised to

TECHNICAL ANALYSIS: KSE-100 (PSX) – 20 JULY 2025 TECHNICAL ANALYSIS: KSE-100 (PSX) – 20 JULY 2025
The index has completed its spike phase marked in light blue color channel and has transitioned into a channel phase marked with yellow channel. This channel phase signifies deeper pullbacks and slower upward movement.
The index recently gave a brea

Bullish but Weekly Bearish Divergence ...KSE100
Weekly Closing at 138721.55 (18-07-2025)
Overall Bullish but
Bearish Divergence on Weekly tf.
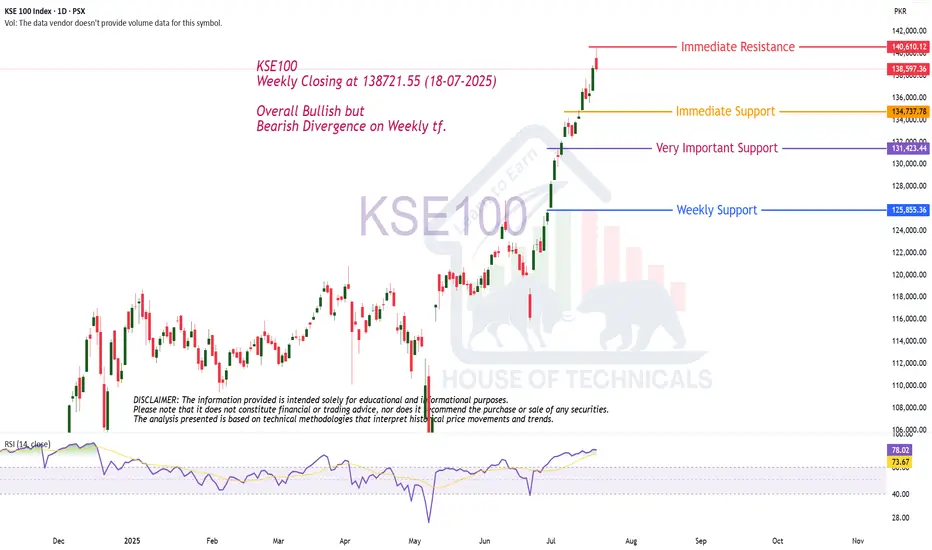
KSE100 & KSE30 on the Daily TFAt the Top of the Ascending Channel on the DTF. Would suggest to be a little cautious.

See all ideas
Summarizing what the indicators are suggesting.
Oscillators
Neutral
SellBuy
Strong sellStrong buy
Strong sellSellNeutralBuyStrong buy
Oscillators
Neutral
SellBuy
Strong sellStrong buy
Strong sellSellNeutralBuyStrong buy
Summary
Neutral
SellBuy
Strong sellStrong buy
Strong sellSellNeutralBuyStrong buy
Summary
Neutral
SellBuy
Strong sellStrong buy
Strong sellSellNeutralBuyStrong buy
Summary
Neutral
SellBuy
Strong sellStrong buy
Strong sellSellNeutralBuyStrong buy
Moving Averages
Neutral
SellBuy
Strong sellStrong buy
Strong sellSellNeutralBuyStrong buy
Moving Averages
Neutral
SellBuy
Strong sellStrong buy
Strong sellSellNeutralBuyStrong buy
Displays a symbol's price movements over previous years to identify recurring trends.