TECHNICAL ANALYSIS: KSE-100 (PSX) – 20 JULY 2025 TECHNICAL ANALYSIS: KSE-100 (PSX) – 20 JULY 2025
The index has completed its spike phase marked in light blue color channel and has transitioned into a channel phase marked with yellow channel. This channel phase signifies deeper pullbacks and slower upward movement.
The index recently gave a break of structure at around 137600 and marked a high of 140594. We expect the pullback to continue downwards, potentially retesting the LTF at 137600, before resuming the third leg of this channel phase.
The market remains in long, and every dip is considered a buying opportunity.
KSE100 trade ideas

KSE 100 Index Technical Analysis 26-07-2025📈 KSE 100 Index Technical Analysis 26-07-2025
The KSE 100 index is moving in an uptrend, albeit at a relatively slowed pace. Although it broke down from the upward channel (marked yellow color), it filled the measuring gap, marked a higher low, and completed its pullback. The index seems poised to resume its upward trajectory.
Key Points
Higher Low Formation: The index has marked a higher low, indicating a potential reversal.
Pullback Completion: The pullback is over, and the index is ready to move upwards.
Powerful and Poised: We find the index very powerful and poised to move upwards.
Target Prices
Immediate TP: 141,500
Final TP: 151,600
Recommendation
The index is always in long, and with the pullback over, we expect it to pursue the mentioned targets.

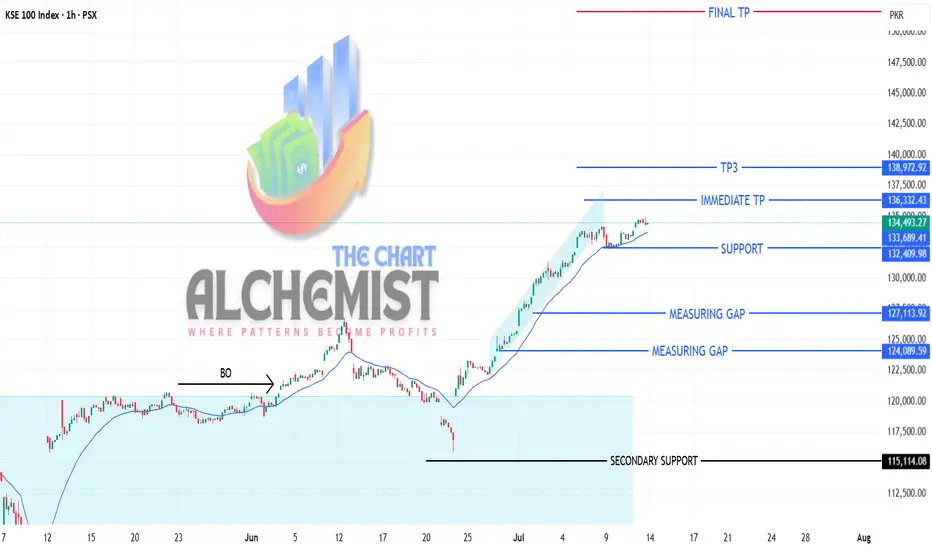
KSE-100 INDEX UPDATE | 17 JULY 2025KSE-100 INDEX UPDATE | 17 JULY 2025
The KSE-100 continues its strong uptrend, hitting a high of 140,931 today—just shy of the immediate target at 141,970.
As expected, the index is showing signs of deeper pullbacks within the channel structure, which remain healthy and present strong buying opportunities. The final upside target stays at 151,600, with the trend firmly intact.
KSE-100 ANALYSIS | 16 JULY 2025📊 KSE-100 ANALYSIS | 16 JULY 2025
As previously mentioned, KSE-100 completed its spike phase, marking a high of 134,240. The uptrend is now transitioning into a channel phase, with deeper pullbacks expected in the short term.
KEY LEVELS:
Support: 20 EMA (1-hour timeframe)
Immediate Resistance: 136,620
OUTLOOK:
Expected to take support from the 20 EMA and resume the uptrend
A break above 136,620 will confirm another leg upward
Targets: 138,970 (TP3) and 151,600 (Final Target)
Let’s keep an eye on the market!

KSE-100 ANALYSIS | 15th July 2025📊 KSE-100 ANALYSIS | 15th July 2025
As previously mentioned, KSE-100 completed its spike phase and took support at 132,300. The index has now transitioned into a channel phase, and today's intraday pullback was expected.
🔹 Key Levels:
Support: 20 EMA at 137,135.80 (acted as support)
Targets:
- Short-term TP: 138,970
- Mid-term TP: 151,600
📈 Outlook:
The pullback is viewed as a buying opportunity. The index remains in long territory and is expected to rebound and resume its upward journey.

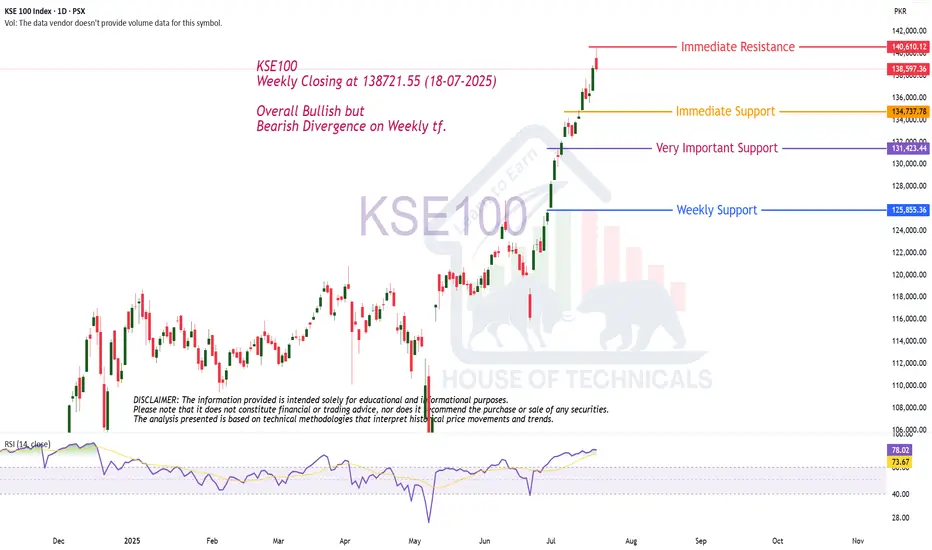
Bullish but Weekly Bearish Divergence ...KSE100
Weekly Closing at 138721.55 (18-07-2025)
Overall Bullish but
Bearish Divergence on Weekly tf.
KSE100 & KSE30 on the Daily TFAt the Top of the Ascending Channel on the DTF. Would suggest to be a little cautious.

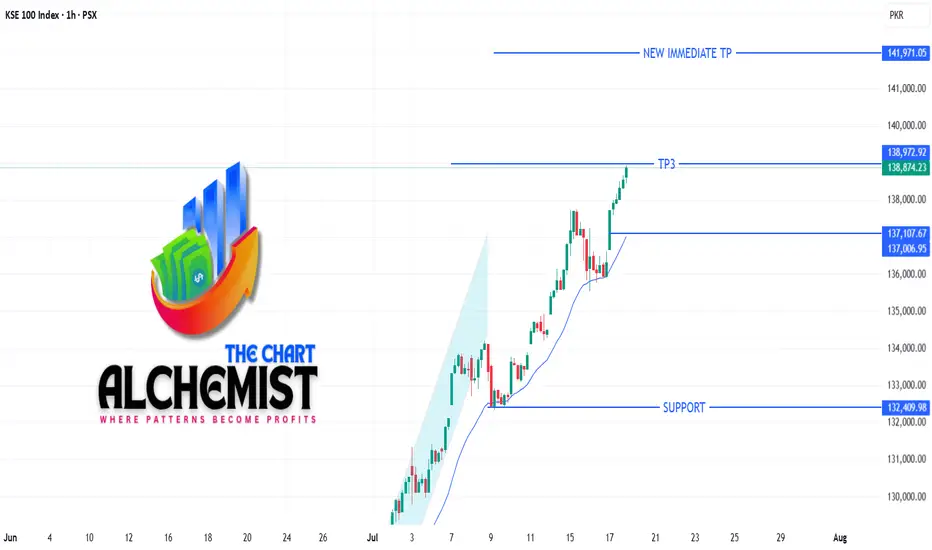
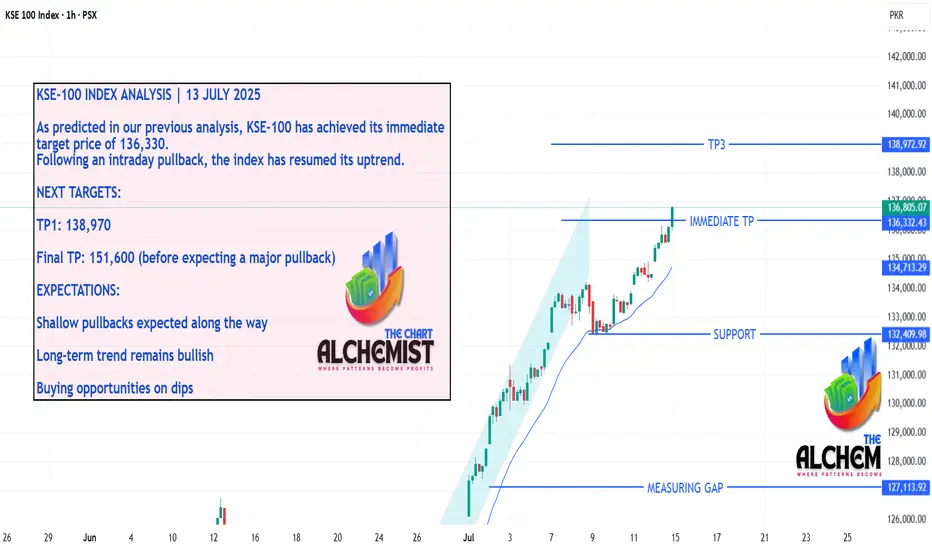
KSE-100 INDEX ANALYSIS | 13 JULY 2025KSE-100 INDEX ANALYSIS | 13 JULY 2025
As predicted in our previous analysis, KSE-100 has achieved its immediate target price of 136,330. Following an intraday pullback, the index has resumed its uptrend.
NEXT TARGETS:
TP1: 138,970
Final TP: 151,600 (before expecting a major pullback)
EXPECTATIONS:
Shallow pullbacks expected along the way
Long-term trend remains bullish
Buying opportunities on dips
KSE-100 ANALYSIS | 13 JULY 2025KSE-100 ANALYSIS | 13 JULY 2025
The KSE-100 index recently experienced a steep uptrend accompanied by shallow pullbacks. However, since July 8, 2024, the slope has moderated, and the index is now trending upward at a relatively mild pace.
EXPECTATIONS:
We anticipate deeper pullbacks in the coming days, but remain confident that the index will achieve its previously set targets:
Immediate Target: 136,330
Intermediate/Final Target: 151,600
OUTLOOK:
The index remains in a long position, adhering to Price Action principles.
TECHNICAL ANALYSIS: KSE-100 | 10 JULY 2025TECHNICAL ANALYSIS: KSE-100 | 10 JULY 2025
As we have mentioned several times, the index is expected to mark only shallow pullbacks,
and this current pullback, which started two days ago, also ended today and didn't go below
the breakdown level that we had mentioned, which was 132,330. In fact, the index resumed
its uptrend and now is on its way to achieve immediate targets.
Target Prices:
Immediate TP: 136,300
TP3: 138,970
Final Target: 151,600 (readjusted and raised due to recent continuous upward moves)
Market Sentiment: The index is very much all in long.

kse 100 indexKse 100 index can take 40-45 more days for next move. either up or down it only needs catalyst. if it goes up it can be after next MPC meeting i.e 10 march, which is more probable seeing current cpi. any bad news can cause it to drop till the next marked support.
KSE-100 ANALYSIS 09 JULY 2025
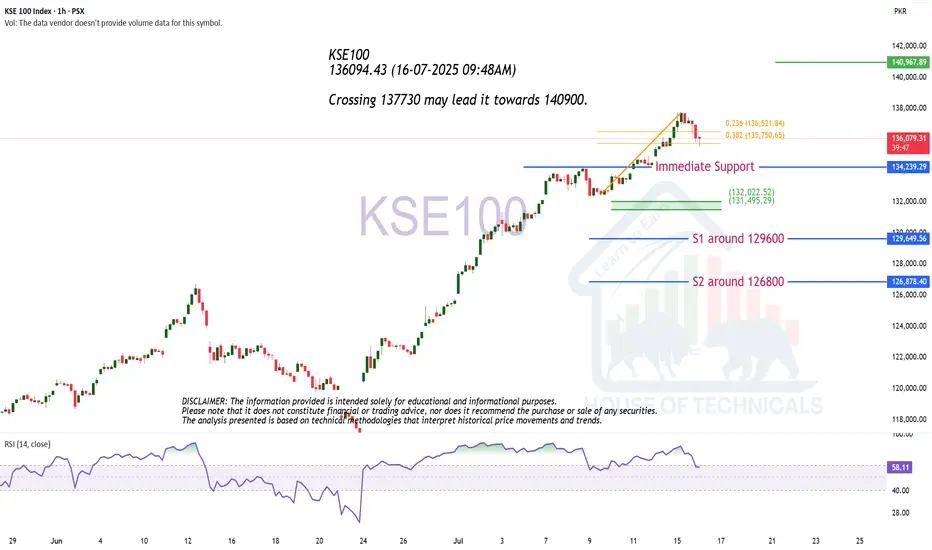
🔍 TECHNICAL ANALYSIS: KSE-100 INDEX | 09 JULY 2025
The index recently pierced the 132,700 level, which appears to be a spring below support, rather than a confirmed breakdown. Based on the current structure, we expect a bounce from these levels. However, if the index closes below 132,390 (the BRD level marked in red) on a 1-hour timeframe, a deeper retracement is likely, with the breakout level at 131,300 as the next key support.
Support Level: Rs. 131,300
Crucial Level to Watch (BRD): Rs. 132,390
Target Prices:
Immediate TP: Rs. 136,300
Further Targets: As previously highlighted
📌 Watch for confirmation around 132,390. A sustained move above this level may resume the upward trajectory, while a breakdown could lead to corrective price action.

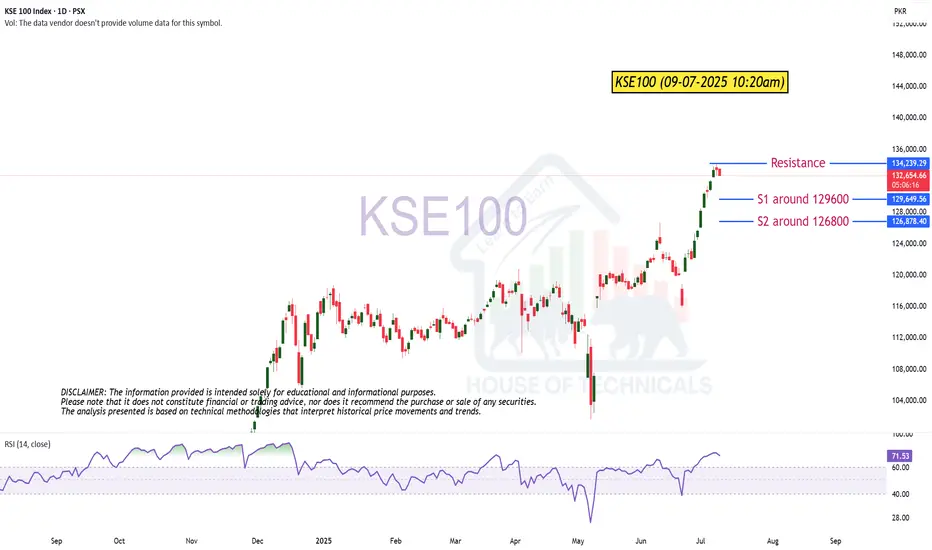
Today's Closing is Important.KSE100 (09-07-2025 10:20am)
Today's Closing is Important.
Either it has to Cross its Resistance. Otherwise , it may Test S1 atleast.
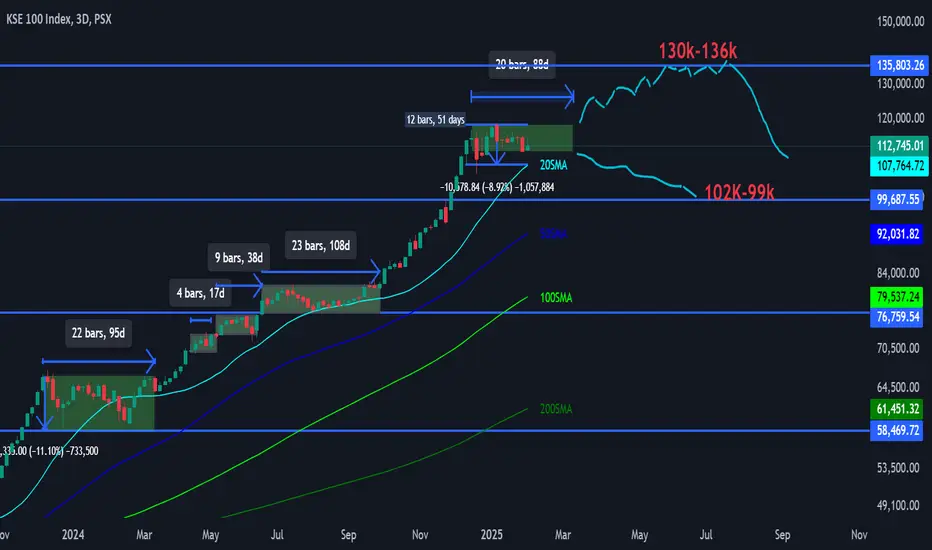
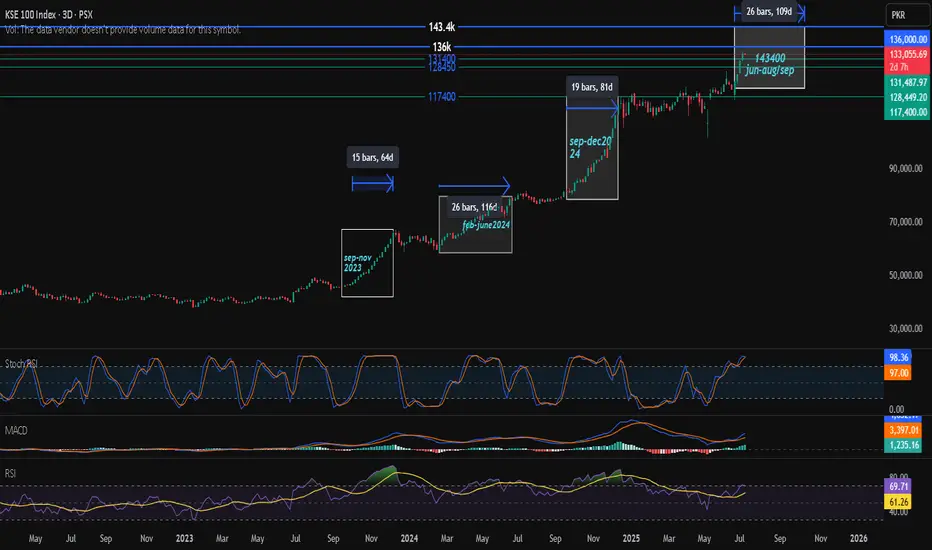
kse 100 indexKSE 100 index has started fresh rally this week. It is expected to break136k sooner after being range bound or taking some correction it will move toward 143k after the news of rate cut. if rate cut not announced then this momentum could slow down or index can take heavy correction but it will ultimately rise till 143k. all the other indicators support this move.
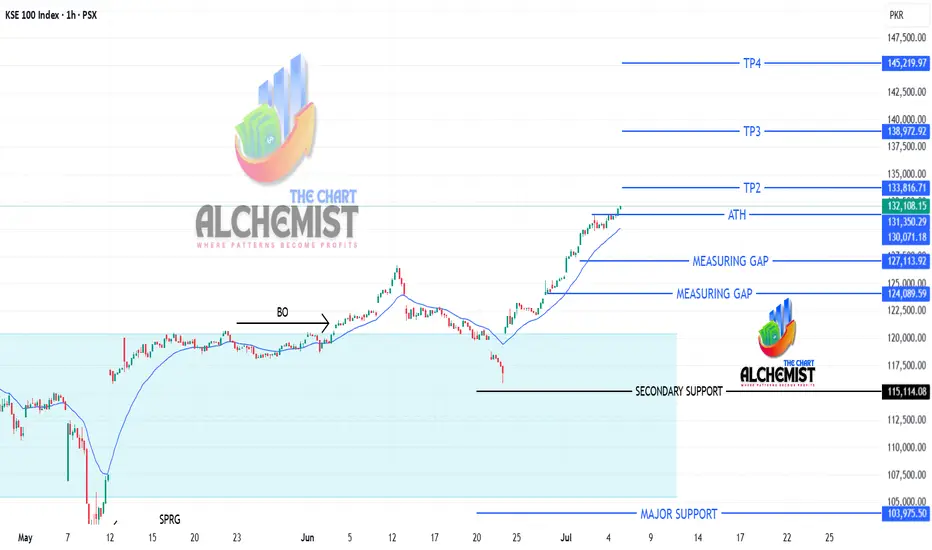
KSE-100 ANALYSIS 08-07-2025📊 KSE100 INDEX ANALYSIS | 08 JULY 2025
The KSE100 Index pulled back to 132,700 and rebounded sharply. However, a bearish candle on the 1H timeframe indicates short-term selling pressure. Two key support levels to watch:
Immediate Support: 132,700 (today’s bounce level)
Secondary Support: 131,350 (breakout retest zone)
We expect a rebound from either of these levels, leading to a continuation of the upward trend. Key targets ahead:
Immediate Target: 136,300
Final Intermediate Target: 148,300
No major corrections are expected at this stage — the structure remains bullish.
📢 Stay alert and monitor reactions at support zones with confirmation from higher timeframes.
Best regards,
The Chart Alchemist and Team

Technical Analysis: KSE-100 Index 06-07-2025📈 Technical Analysis: KSE-100 Index
KSE-100 is moving precisely in line with expectations, validating our previous outlook.
After completing a shallow intraday pullback, the index has successfully achieved an intermediate
lower timeframe target today.
We maintain our bullish outlook with the next key target set at 145,200. As long as the index continues
with shallow corrections, this target remains well within reach. Should a deeper pullback occur, we will
reassess and potentially revise the upside targets higher.
🧭 Current Target: 145,200
📌 Target revisions will follow only after a major correction or pullback.
Let’s see if the KSE-100 can hit this milestone in style!

KSE-100 ANALYSIS 03-07-2025KSE 100 Index Technical Analysis (15-minute timeframe)
After completing a short-term uptrend and achieving a high of 131,350, the KSE 100 index went into an intraday pullback, forming a spring pattern (marked on the chart). The pullback ended at 129,960, and the index reversed upwards.
Key Observations:
- Shallow intraday pullback, indicating strong underlying momentum
- Spring pattern formation, suggesting potential for upward continuation
- Reversal from the pullback level, confirming the short-term uptrend
Targets:
- Short-term Target: 132,000
- Midterm Targets: Remain unchanged, with the final target at 138,970 (as highlighted in yesterday's update)
Let's monitor the KSE 100 index's performance and see if it achieves the targets.

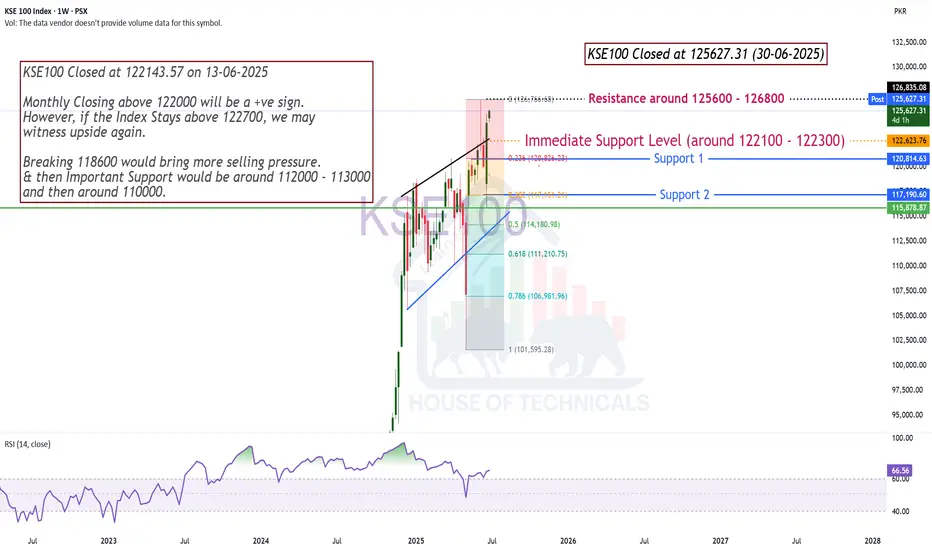
Bullish!Immediate Support Level (around 122100 - 122300)
Note the Resistance is around 125600 - 126800
PSX-BEARISHIN current situation at 4 hour market is in heavy correction but stay calm it will be end soon INSHA ALLAH . Looks the targets when market retrieve or take more dip.

Monthly Closing above 122000 will be a +ve sign.KSE100 Closed at 122143.57 on 13-06-2025
Monthly Closing above 122000 will be a +ve sign.
However, if the Index Stays above 122700, we may
witness upside again.
Breaking 118600 would bring more selling pressure.
& then Important Support would be around 112000 - 113000
and then around 110000.

KSE100-BEARISHAT that time market is bearish according to patterns here is three patterns 1. rectangle 2. bearish peanut 3 bearish flag at 15 minute time frame.
