Monthly Closing above 122000 will be a +ve sign.KSE100 Closed at 122143.57 on 13-06-2025
Monthly Closing above 122000 will be a +ve sign.
However, if the Index Stays above 122700, we may
witness upside again.
Breaking 118600 would bring more selling pressure.
& then Important Support would be around 112000 - 113000
and then around 110000.
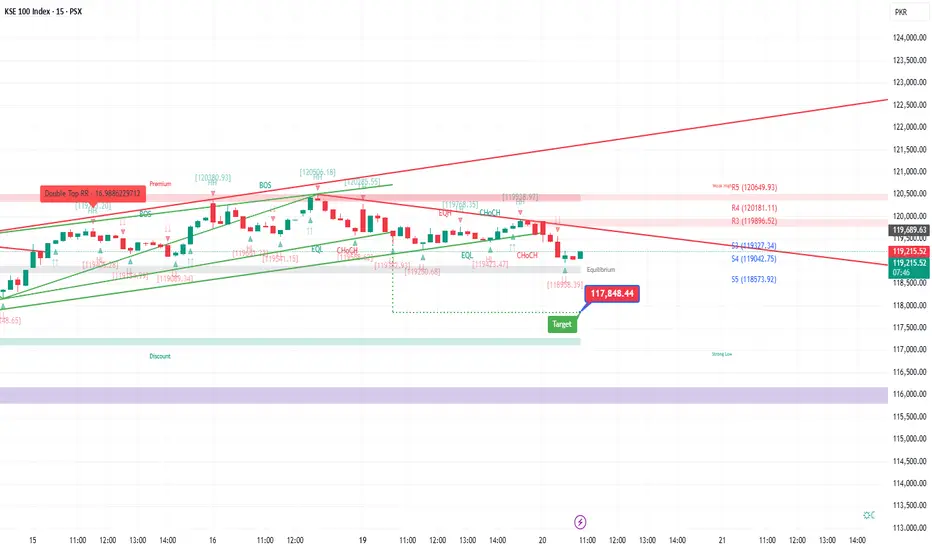
KSE100 trade ideas

PSX 100 index zones 16/5/2025PSX 100 index zones for 16/6/2025
Bullish 122523
Bearish 121764
It is expected in bullish zone. Note: This is not a buy/sell trade call. It is an analysis.

KSE 100 | Gap UP OpeningKSE 100 gave a gap up opening after budget of fiscal year 2025-26.Sometimes these gap up or gap down openings are triggered by some news.

KSE-100 UPDATE 12-06-2025KSE 100 Index Technical Analysis
The KSE 100 index has been performing well after its breakout from the all-time high, achieving multiple targets as expected. Despite some retracement in the last 2-3 hours, the index remains mostly bullish. The small pullbacks are expected in any uptrend.
Current Market Situation
- The index is currently testing its EMA 20 of 1-hour timeframe.
- A rebound from this level is expected in the coming sessions.
Possible Scenarios
- If the index rebounds from the current level, it will likely continue its upward trend.
- If it fails to rebound, there's a possibility of a retest of the recent breakout level at 120,800.
Support Level
- The index is expected to find support at the EMA 20 of 1-hour timeframe and rebound from there.
Overall, the KSE 100 index is expected to remain bullish, and the current pullback is seen as a buying opportunity.

Another Possible Setup of Cup & Handle
Closed at 120538.01 (03-06-2025)
Another Possible Setup of Cup &
Handle is appearing on Top.
But still Resistance od 120660 - 120700
is there.
If crossed, 123000 is on the cards.
On the flip side, slight bearish divergence is
there on shorter tf, so dip can be a buying
opportunity.
Hoping for a Good Move Upside! Inshaa ALLAH!

KSE100 UPDATE 2/6/25We have been telling all along that Index is bearish, though it has been in a Pullback Rally which is forming right shoulder of H&S pattern.
Index will be considered bullish only when it crosses and closes above 1,21,000 on 1D basis.
Till then we should avoid impulsive buying and observe given Entry/Exit levels with strict Stop loss levels as given for each Scrip.
On positive side the Index is very much safe above 1,18,000 level. Beyond that Secondary Support lies at 1,15,100, which also happens to be target level in case of Breakdown of neckline of H&S Pattern

KSE100-BULLISH ON 15 MINTwo pattern are in progress at 15 min time frame Head & shoulder and Rectangle these shown bullish movementum in future so keep watching levels for breakouts.

Potential Inverse H&S120660 should be Crossed & Sustained
for further Upside (with Good Volumes)
Inverse H&S Potential Target is around 138000-140000

KSE10 - BEARISHIn an other scenario 15 minute time frame its break it,s rising wedge formation it can pull back from here after its correction which i shown in diagram
KSE100 - BEARISHMarket can retest again its previous low because in current scenario market again in triple top pattern it indicates a big correction again.

KSE100 UPDATEAnother futile attempt by the index to break the shackles and blast off from the congestion to new uptrend.
On 1H TF the index hasn't touched the EMA for more than 20 candles, which is sign of strength
Index is expected to take support from 20 EMA on 1H, which is around 1,18,700.
index is considered safe and poised to breakout till it's trading above the Breaker Block which is below 1,15,100.
Conclusion : Trade based on technical analysis not emotions

KSE 100 index strong resistance levelsKSE 100 index strong resistance levels
119664, 122571, 132431, 140142, 145325, 157838 and 177941

Has it Bottomed Out or Bottom yet to come?Seems like it bottomed out around 101400 - 105000
Next Expected Reversal Level
93728 - 94188

KSE100 REVISED UPDATEWith positive change in Geo-Political situation, bullish sentiment will overpower bearish forces in coming days, As already discussed previously market rebound over 1,05,800 lvl on Friday which brought it inside/above major support zone. Now with positive change in sentiments, market is expected to touch/cross initial resistance zone of 1,15,000 very quickly.
Please close/ ignore previous short calls.
Long trade calls will be shared today and tomorrow

KSE100 UPDATEKSE100 broke two major supports yesterday and completed its distribution phase which had started in Dec 24
It is technically in bearish phase now, since it has given CHoCH ( change of character to bearish) and made bearish breaker block also. Though market recovered around 4000 points today but it is just a healthy pullback. Market will continue to be bearish till it gives bullish CHoCH by crossing over 1,15,000 level.

KSE100 UPDATEKSE100 broke multiple strong supports today, it has broken neckline of double top chart formation
If this down move is not reversed above 1,09,300 tomorrow, measured move downward shows next level for KSE100 as 98000

Hoping for the best.
Closing within this box (above 109000)
would be a relaxing sign. Inshaa ALLAH
& Closing above 111500 would be a
Healthy sign.

KSE100 UPDATEThough Index is still technically Safe/Bullish at current levels, mainly because of trading above major support/order block at 110,800, next lower support is 1,09,400. If index closes below these levels in coming days, then it'll start a major bearish cycle

KSE100 UPDATEKSE100 is safe above1,12,400. It can sustain its bullish momentum if it crosses above 1,14,980 level, however in case of fall below 1,12,400 level Breaker Block and Gap it'll start its immediate down leg
No new longs be established before 1,15,000 level

Played exactly the same as predicted last week. KSE100 Closed at 114113.94 (02-05-2025)
Played exactly the same as predicted last week.
Now seems like Hidden Bullish Divergence is appearing.
Important Supports :
S1 around 113100 - 113400
S2 around 110500 - 110800
Important Resistances :
R1 around 114630 - 115120
R2 around 117000 - 117500

KSE100 UPDATEThough KSE100 seems to be in a freefall due to border situation but it has major supports at 110,000 and 1,09,500
Final major/lifeline support for KSE100 is 1,05,500
KSE100 will resume it's upward momentum only after closing above 1,12,100 on 1D basis

KSE 100 index (PSX 100 Index) could drop to 110,580This is day time frame chart of KSE 100 index. These are fabionacci levels.
120,898, 110576, 104191, 99030, 93870.

KSE100 UPDATE, YES IT IS STILL BULLISHThough one may think market is inherently weak now but it is taken support from redrawn trendline (connecting 2 most recent lows).
KSE100 is still bullish till it's trading above that beautiful blue Order Block
Let's not worry yet
