Kse100-consolidationAccording to technically in psx not a big bounce is showing at least two months after that it will be a bull move can start. In this era selective stocks could perform so change your selections of stocks time to time.
KSE100 trade ideas


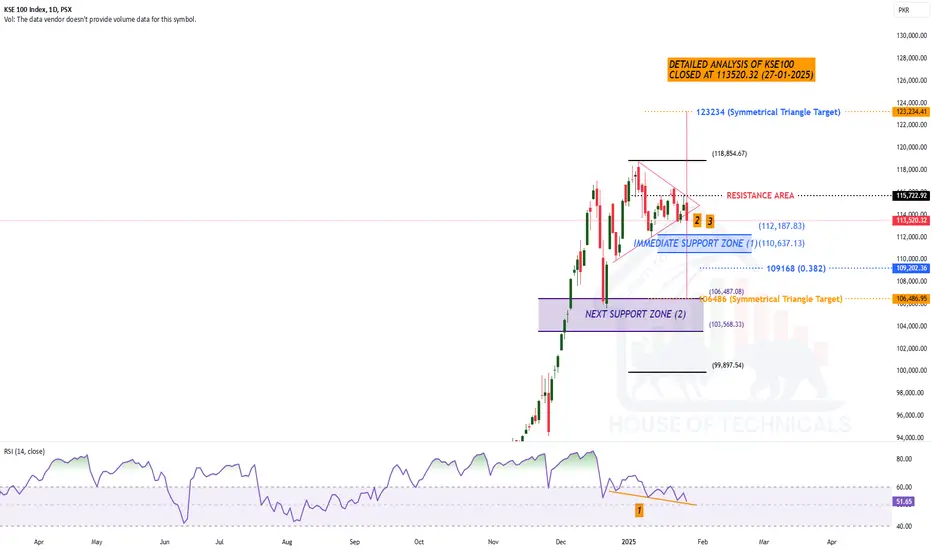
KSE100 Yet to Clear its Direction.
I have also put 3 test cases for Future Learning that I will share with My Students later Inshaa ALLAH.
Under all those Test Cases, Index should show Positivity in Upcoming Days (may be tomorrow or onwards). But Tomorrow's Closing is Important to see.
Either it fails or play (as expected), there would be a lot of New Learning (for me atleast) Inshaa ALLAH.
But You Guys, Focus on Your Scripts 😛
GALA's Explosive Potential – A Technical Outlook for 2025Current Market Structure & Momentum
GALA is currently trading at $0.0285, up by +4.61%, showing signs of potential accumulation. The chart presents a strong historical cycle of breakouts (BOS – Break of Structure) and retracements, which typically indicate a high-volatility asset gearing up for another bullish wave.
Key Bullish Indicators
Smart Money Concepts – The presence of Buy-side Liquidity at multiple levels signals that institutional players may be accumulating. Historically, such patterns have preceded massive price surges.
Nadaraya-Watson Envelope Support – The price is currently in a discount zone, meaning this could be a prime accumulation phase before a major rally.
Historical Pump Patterns – Previous price cycles show massive price expansions following extended accumulation periods. The last breakout saw an explosive run from $0.015 to $0.08 (~+400% gain).
Price Targets & Potential Growth
If GALA follows a similar trajectory, a 300% move from the current levels would target $0.12, aligning with historical resistance zones. However, if macro factors, gaming adoption, and broader market trends support the rally, a full-scale bull run could push prices towards the $0.50 to $1.20 range in 2025.
Investor Takeaway
🔹 Current accumulation zone suggests a strong potential for an upcoming rally.
🔹 Break of key resistance levels (around $0.05-$0.07) could fuel a parabolic move.
🔹 Long-term holders and strategic investors may find this an ideal accumulation zone before a potential explosive breakout.
With increasing blockchain gaming adoption, a growing Web3 ecosystem, and GALA's historical patterns, this could be a golden opportunity to position yourself before the next wave of institutional and retail interest floods in! 🚀🔥

Further Deep Down Analysis a Detailed Analysis of KSE100 Index:
as for now, Individuals are the Major Sellers.
It is expected that in upcoming days, we may
witness further selling from Major Buyers of
these days.
There is a chance that Index may show us 102000 - 102500
in upcoming days & may be 96500 in worst case.
There is no harm untill Index stays above 94000; but...
Best Strategy should be to Sell in Profits or even
Breakeven Levels & then wait for a Proper Dip.


Play WiselyMonthly Candle as of Today (21-01-2025) is DOJI which is
actually indecisive. (Neutral)
Index is Bullish on Bigger TF. (Positive)
Hidden Bullish Divergence on Daily TF (Positive).
Broke the Trendline (Negative) but Possible Re-Testing around 118000 (Positive).
Weekly Bearish Divergence. (Negative)
Weekly & Monthly Closings are Very Important.


Play WiselyIt seems that Index may touch around 115000 - 115300
once before going further down (if it has to).
It has touched the first Support level (around 112750 as mentioned on 05-01-2025)
The Stance is Still the Same that 118900 is Important to Cross with Good Volumes
to Continue the Bullish Momentum.


Bearish Divergence on Daily TF.Bearish Divergence on Daily TF.
Either it should break & sustain 118400 or
it should take a breathe and retrace up till
112750 and may be till 109000.
For Swing Trades, 105600 is the Important
Support level that should not be broken.
Once, 118700 is Crossed & Sustained, we may
witness New Highs of the Index around 130000.

KSE 100 Analysis 1st scenario
1. Volumes are decreasing
2. There is bearish divergence
3. Market may be retest is last lower low
and bounce back for higher high with good
Volumes
4. Due to divergence on RSI and
MACD market may be consolidated
for some time to cool of and than
goes to next highs
2nd scenario
1. Volumes are decreasing
2. There is bearish divergenc
3. If market break its last
Lower low and still volumes
are decreasing than it goes
to next support


KSE100 Index PSX -Analysis based on Elliott Wave & Benner Cycle PSX is in a bull run which is proving to be quite phenomenal.
Now the big question is where is the market top and when will it be?
Elliott Wave Theory and Samuel Banner's Century Cycle chart are the ones which I'm going to use here.
As per Benner's cycle the current bull run began in Jan 2024 and its top should be in December 2026. However, since we know that the bull run actually began in Sep 2023, therefore, by adjusting this time frame we arrive to the top by Sep 2026. (See the picture on the chart).
Referring Elliott Wave Theory - we know that it has two sets of Waves ie "IMPULSE" (1,3 & 5 along with retracement waves 2 & 4) and "CORRECTIVE" (A,B,C).
Accordingly, for me the price is in wave 3 and its completion will be around 133,000 and then it may retrace to Fib 38% (PKR 93,000 appx). Then the last wave will begin which may complete around Rs 192,000. This value has been arrived using Fib Ext Tool. So per this analysis 192,000 is the area where we should expect the TOP by end Sep 2026. Then market will go down following Corrective Wave A-B-C till end 2032.
(Note year mentioned on the Benner Cycle chart are the end of the year i.e. 31 Dec )

KSE 100 index - Correction Underway!The index after making HH @ 117039, has gone into correction, the index has retraced to 0.5 level of FIB today, another possible retracement could be till 102,000, in worst case scenario, it will be retraced to around 100k
The index as per my analysis is likely to make a reversal from these levels as 21 moving average has been tested !
Stay tuned for more updates. Keep your SL on all your stocks in place to secure your profits.

KSE 100 index is bullish until 2028KSE 100 index is bullish until 2028 to hit Life time High 350K around 2028.
But before that it is going to see 100K in coming weeks 2024-25 then rebound up towards 125K and strongly rejected downward to hit around 80K in 2026 and the start a new 4-5 year rally towards the LIFE TIME HIGH values expectedly around 200K+ and probably 350K

KSE 100 is ready for a short CorrectionHow's the Josh Pakistani Traders !!
This folk from India is Analyzing your Stock market, I hope you will Like IT!!
HERE WE GO WITH THE DETAIL
As we can clearly see that market has Completed its Wave 3 (Wave 3 is an impulse wave of Elliot wave structure) and Wave 3 is Extended Wave to 3.618 % of Wave 1.
So Wave 4 would be 0.382 % of Wave 3 ( Wave 4 is Corrective wave in Elliot wave theory).
SO HERE IS THE TRADE
SELL KSE100 @ 118,000-120,000
TARGET @ 87000
SL @ 123,000
NOTE : THIS IS FOR EDUCATIONAL PURPOSE ONLY PLEASE REFER TO YOUR FINANCIAL ADVISOR BEFORE TAKING ANY TRADE
HAVE A GOOD DAY TRADERS

Index is Still Bullish as long as stays above 107000.
In Shorter TF, Index should reverse from the
level around 110100 - 111000.
Important Support Levels:
S1 108500 - 110392
S2 105825 - 107445
Important Resistance Level:
116700 - 117100
To continue the Bullish Momentum,
Index needs to Break & Sustain 117100.


Selling Seen.. But...Today Index went up till 111759 &
then dropped to 107711 (movement of
around 4000 points).
Now, Immediate Support levels are
S1 107500 - 107700
S2 105000 - 105500
In worst case, Index may touch 100800 &
then rally upside again.
On the flipside, Immediate Resistance levels are
R1 111850 112000
R2 115000 116000

