LOTCHEM PROBABLY IN WAVE ' X ' OR ' Y ' OF A CORRECTIONAs per our preferred wave count LOTCHEM is in wave Y which should take prices further down toward the 13 level and if bearish trend stays strong then even 9.50 is on the cards, however prices need to break below 15.53 level first.
Alternately prices can still be in X wave and will take prices further up towards 25.40 - 27.40 range and if the bullish trend stays strong 31 level is also at hand, however prices will have to break above 20.20 level first.
As the overall momentum of the PSX is bearish and our preferred wave count is bearish, We will activate short sell trade once price close below the red trendline on the daily chart.
Incase prices never close below the red trendline and starts rising, We will enter long position at 20.20 targeting 25.40 range. I will share stop loss for the trade setup once our trade gets actived
Let see how this plays, Good Luck!
Disclaimer: The information presented in this wave analysis is intended solely for educational and informational purposes. It does not constitute financial or trading advice, nor should it be interpreted as a recommendation to buy or sell any securities.
LOTCHEM trade ideas

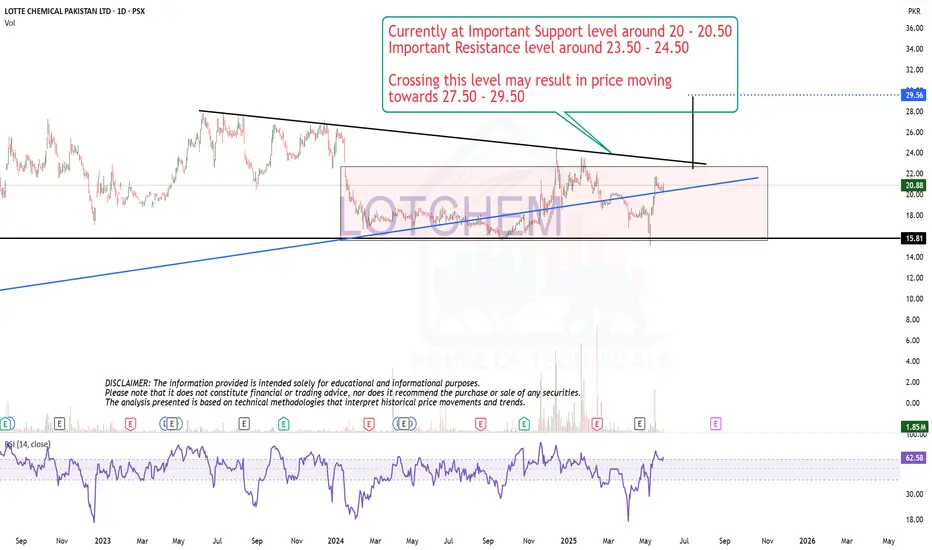
LOTCHEM is bullishLOTCHEM has completed its retracement and already formed HL, now it's moving to form new High.

Seems like taking SupportCurrently at Important Support level around 20 - 20.50
Important Resistance level around 23.50 - 24.50
Crossing this level may result in price moving
towards 27.50 - 29.50
Play on levels.Now Important Resistance is around
22 - 22.40
Bullish divergence is there but also
near resistance. One may wait for the
resistance level to cross for Fresh Entry.
On the flip side, Godd Support level is
around 19.50 - 20.80

Bullish divergence is there but
Bullish divergence is there but
19-19.10 is Important to Sustain on
Monthly basis.
also there is a Very Important
Support around 16.30 - 17.20


LOTCHEM Gearing Up for a Bullish Comeback? OTCHEM appears to be forming a potential bullish reversal after finding strong support near 18.50-19.00. The stock is attempting to break out of its consolidation phase, with RSI stabilizing near 50, signaling a possible shift in momentum. A decisive move above 20.50-21.00 with strong volume could trigger a rally toward 23.50-24.00, making it a key breakout zone for traders. With volume still on the lower side, a spike in buying interest could confirm the uptrend. Keep an eye on this level—LOTCHEM might just be setting up for its next big move!

a Bounce is expected from the Current level but Resistance aheada Bounce is expected from the Current level.
but 21 - 21.20 is a Very Strong Resistance.
as of now. & if it is Crossed with Good Volumes
& Sustained, we may see the price touching 22.50 - 23.50
& lets enjoy further upside above 24 - 25.
However, Monthly Support is around 16 - 16.50.

LOTCHEM - looks good for longsthis is not a buy or sell call
make your own analysis and study the patterns
no blame no claim
lotchem is making cup+handle formation, if completed, it can reach to 28.5~29.7 range


Weekly Closing is not bad.Weekly Closing is not bad.
However, 17 should not be
broken.
Monthly Closing above 18.70 will
trigger further positivity.

LOTCHEM Is Going Up; KSE100 Is Going Up; Green!!!LOTCHEM has been trending upward along its 20-day moving average since November 18th. This demonstrates positive growth, and while the current performance is encouraging, there is potential for further gains. Notably, trading volume has been increasing, signaling growing market interest. The price crossed above the 200-day moving average just four days ago, confirming the onset of a bullish long-term trend.
In the chart presented, I am illustrating a medium-sized bullish wave, which may continue to develop over an extended period. For the time being, I am setting a target of PKR24.
Feel free to follow me for more insights if you find the content valuable. I will continue to share updates and analysis.

Buy Call ;-)Buy above 18.50
Sell around 20.50
Stoploss 16.50
There seems to be a positive move in it soon. IA

Lotchem is likely to breakout 21.5 to go to 26.19Lotchem is going to breakout level of 21.5, after it next levels are 22.43, 24.07 and 26.19. SL is as per your strategy
Note: This is not a buy/sell call.

Lottechem-Pakistan-BuyBullish Divergence on dialy Time frame
Breakout of Descending Wedge
Printing of HL,
Breakout and sustain last LH level will give strength to Bulls
SL just below Last LH, TP-1 may be targetted

LOTCHEM is BullishPrice was in a strong downtrend respecting a descending trendline since Mid April, however matured bullish divergence on daily time frame, finally seems to be playing out as trendline is broken and if bulls manage to breach previous lower high then as per Dow theory we can expect a bullish rally. Targets are mentioned on the chart.

PSX : LOTCHEMLOTCHEM has been experiencing some downward presseure recently and now in a accumulation phase since february.
Currently the price has completed the harmonic ABCD pattern at strong daily support level with a bullish div. Now sellers seems to be exhausted at support area and buying pressure seems to be activated.
Entry 19.10
SL 16.50
TP1 21.71
TP2 24.30

LOTCHEM is showing divergence in 1D time frameLOTCHEM is showing divergence in 1D time frame and also in accumulation phase..

LOTCHEM | PSXLOTCHEM is sustaining its horizontal support and trend line support support, a pull back from this level can be expected. Moreover, RSI indicator also at over sold level. Long position can be taken around 18.20 with the stop loss at 16.75 ( just below previous low) for the target of 21.80 which is the resistance level.

LOTCHEM - ABCD PATTERNAfter a bearish trend, LOTCHEM is expecting a reversal trend , good bullish move is expected. Long entry recommended in LOTCHEM.


LOTCHEM is BullishLOTCHEM is currently on the verge of breakout from the declining phase following the appearance of bullish divergence on RSI. It is about to break a lower high and would print a higher high instead, and then start a bullish rally. Targets are mentioned on the chart.

LOTCHEM | Falling Wedge Pattern
The price action is currently confined within converging trend lines, indicating the potential for a breakout. Consideration may be given to initiating a long position following a breakout from this pattern, with a stop loss set at 18 to mitigate potential losses in the event of a downward break below the channel. Initial resistance is positioned at approximately 21, with a secondary resistance noted around 22.15. Upon successful breach of both resistance levels, attention should be directed towards a prominent supply zone positioned near 24.43.
