MARI ShortSince July 2023, Mari has never breached and closed below SMA10 on monthly timeframe.
If it breaches it and closes below 588, the downfall will be sharp.
Its first stop would be 519 and then 446 and 415 can also be on cards.
Sorry for Mari lovers but it can become a harsh reality.
However, 415 to 446 can be an ideal time for accumulation for long term investment purpose.
its not a buy / sell call, just my personal opinion.
MARI trade ideas

Mari Key levelsMari is in bullish trend and buying is possible with blue lines TP and red line SL
Note: This is not a buy/sell trade call.
MARI Trade Idea1- Price is in uptrend and HH/HL are intact.
2- Price is stalling within golden pocket zone.
3- Price squeezing in between wedge pattern.
4- RSI on weekly @ 52 and monthly @ 66 which
is showing that bullish momentum is intact.
5- We need to wait for bullish candlestick pattern
within GP or breakout of the wedge pattern.
.

MARI Petroleum Company Ltd (PSX) Buy Idea✅ Buy Idea Summary
Symbol: MARI
Timeframe: Daily
Current Price: 652.96
📊 Analysis & Plan
Context:
Price has bounced from a higher-timeframe demand zone (highlighted in blue) and is currently forming a bullish structure.
Key Observations:
Swing Failure Pattern near top (distribution clue).
Liquidity Pool marked at 720 — likely target for short-term buy-side liquidity.
Strong bullish reaction after price tapped near the low of the previous range.
🛒 Entry:
At/around: 652.96 (Post price).
🎯 Target Levels:
TP1 (Partial/Intraday): 720 (Liquidity Zone)
TP2 (Major Target): 829.88
TP Final: 900.23
🛑 Stop Loss:
Below 539.13 (last swing low and structural invalidation)
📥 Reinforcement Buy Zone:
Blue Demand Area (around 460–500):
“If I got here, I will look to buy more.”
→ A key reaccumulation area if price revisits.

MARI PROBABLY IN WAVE '' C '' OF CORRECTION - SHORTThis is in continuation to our ongoing tracking of MARI.
MARI is most probably in wave C of an ABC correction and since prices moved down giving confidence to our bearish wave count, we are taking a small position by short selling.
Due to market volatility we will trade this setup with cautious using trailing stop loss until we reach our target. We only recommend small positions at the beginning and once prices starts to unfold in our favor we will add more to our positions on bounce backs
Alternately prices can move up toward 650-660 level which is highly unlikely now but not out of question
If our wave count is correct then we can make around 8.50% or 15.50% on this trade.
Trade setup:
Entry price: 604
Stop loss: 632
Targets:
T1: 535-550
T2: 515-500
Let see how this plays, Good Luck!
Disclaimer: The information presented in this wave analysis is intended solely for educational and informational purposes. It does not constitute financial or trading advice, nor should it be interpreted as a recommendation to buy or sell any securities.

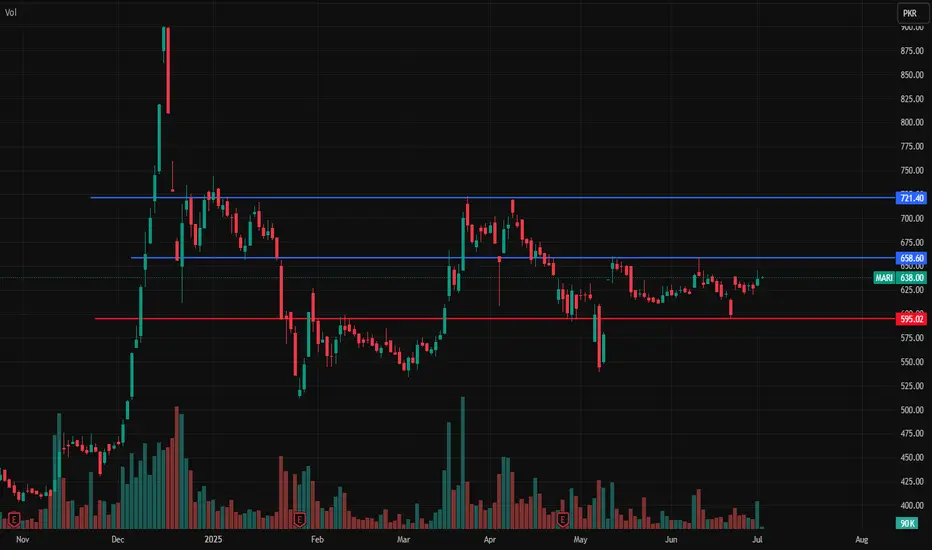
Mari Swing trading targetsMari is entered into bullish trend and entry is possible, TP1 is 660 and TP2 is 700. SL is 593.
Note: This is not a buy/sell trade call. trade at your own will and analysis. This is for education purpose.

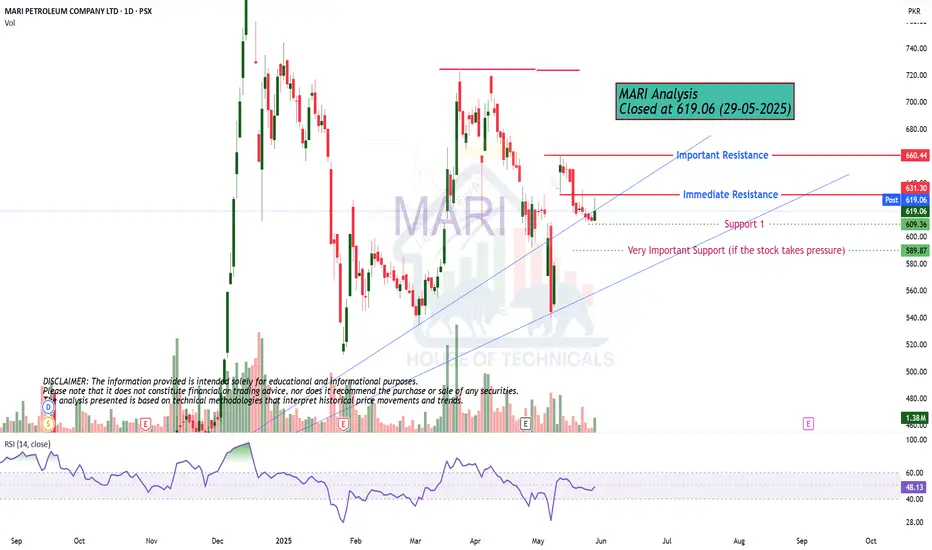
Hidden Bullish Divergence
Hidden Bullish Divergence has appeared.
Bullish on Bigger tf.
Doji formation.
Immediate Resistance is around 642 - 650.
Important Support levels for now can be
around 595 - 605.
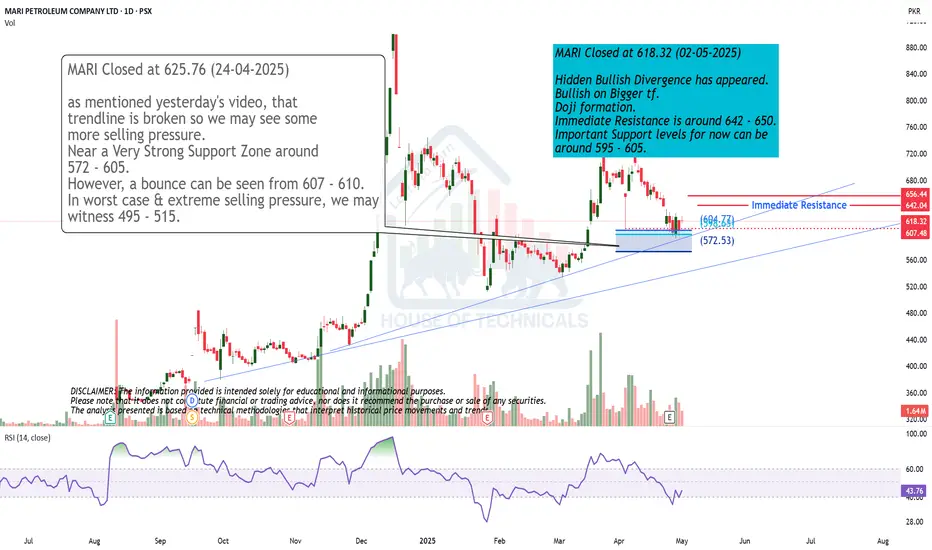
Play on levelsas mentioned yesterday's video, that
trendline is broken so we may see some
more selling pressure.
Near a Very Strong Support Zone around
572 - 605.
However, a bounce can be seen from 607 - 610.
In worst case & extreme selling pressure, we may
witness 495 - 515.

MARI PROBABLY IN WAVE '' C '' OF CORRECTION - SHORTThis is in continuation to our ongoing tracking of MARI.
Since prices moved down giving confidence to our bearish wave count, we are taking a small position by short selling. They are several possibilities at hand therefore we will trade this setup with cautious using trailing stop loss until we reach our target.
We only recommend small portions while short selling due to the fact that futures have less liquidity/volume.
If our wave count is correct then we can make around 10.85% or 13.04% on this trade.
Trade setup:
Entry price: 682
Stop loss: 721
Targets:
T1: 608
T2: 593-578
Let see how this plays, Good Luck!
Disclaimer: The information presented in this wave analysis is intended solely for educational and informational purposes. It does not constitute financial or trading advice, nor should it be interpreted as a recommendation to buy or sell any securities.

Play wisely.Cup & Handle Formation.
But Bearish Divergence is there which is dragging
the price down.
Immediate Resistance now is around 678 - 680.
Next Support is around 638- 651.
The Bullish Momentum will resume once it
will Cross 725

MARI PROBABLY IN WAVE '' 4 '' ( TEAL COLOR )- LONGThis is in continuation to our ongoing tracking of MARI C or 3 wave structure.
If the wave count is correct then we are in wave 4 of wave C or 3 which will most probably reach 661 - 627 range near which I've marked the buy zone. Trading wave 5 is a little tricky because there are multiple factors at play here therefore we will use cautious approach to trade this.
Firstly predicating completion of wave 4 is very difficult, secondly chances of 5th wave failure are also present which means prices might not make a new high, thirdly is the proportion between the 2 and 4 wave (marked in teal color) in which case prices will not even reach the buy zone and will start rising from 680 level up.
So here is how we gonna trade this, since we have already made profits from the last 2 waves of MARI that I published. We will not be taking full positions here but just a small chunk, we will just invest 25% of our investment here and will only enter long positions between 654 - 632 range .
Although we have marked the buy range from 661 but we will only enter between 654 - 632 zone, if we don't get that price we are not trading this last leg up. Below 632 will increase the chance of 5th wave failure and if prices go below 611 then our entire wave count will get weaken.
Trade setup:
Entry price: 654 - 632
Stop loss: We are not marking any stop loss here because MARI has very strong fundamentals therefore we are bullish in it for the long term and since we our only taking 25% portion of our investment on this trade therefore we will hold them for our long term target of 1350 - 1500 just incase if the market goes against us.
Target: Will update after completion of wave 4
Let see how this plays, Good Luck!
Disclaimer: The information presented in this wave analysis is intended solely for educational and informational purposes. It does not constitute financial or trading advice, nor should it be interpreted as a recommendation to buy or sell any securities.

MARI Analysis- Long Trade13/4/25
TF 1D/3H
Ph D complete
Buying1 660-690
Buying2 btw 720-740 after second BO
TP 890
SL below 620

Play on Levelsas discussed in Yesterday's Video, 720
is the resistance level. it resisted exactly from
this level.
Now Support lies around 700 - 702 & then
around 677 - 679
If 725 is Crossed with Good Volumes, we may witness
800.

MARI - ProjectionsProjections 1000+ PKR
AB = CD
MARI made a correction at 0.618 Fib, of Last AB Wave.

Play on LevelsMonthly Support is around 640 - 674.
Monthly Resistance is around 702.
Closing above this level may expose
levels around 750 - 755 & then around 780.
This time breaking 620 will bring more
Selling pressure towards 575-578.
Bullish on Weekly & Monthly TF.

MARI PROBABLY IN WAVE '' 4 '' - LONGThis is in continuation to our ongoing tracking of MARI C or 3 wave structure.
If the wave count is correct then we are in the 4th wave of a bigger C or 3 wave, as wave 4 can be any corrective patterns it is hard to predict them. They can be sharp or complex and can be frustrating at times.Currently the wave structure look smooth and it doesn't seem like that it will get complex but you never know what market will do.
We will buy long positions once price reach our buy zone range 624 - 610, however if the sentiments get very bullish prices might not even get to this range and start rising for the 5th red wave but we should not act greedy chasing every move.
If you are an aggressive trader you can enter long positions as the over all direction is up but we will wait for the price to come into our buy zone range 624 - 610 or touch/breach the below yellow trendline.
Let see how this plays, Good Luck !
Disclaimer: The information presented in this wave analysis is intended solely for educational and informational purposes. It does not constitute financial or trading advice, nor should it be interpreted as a recommendation to buy or sell any securities.

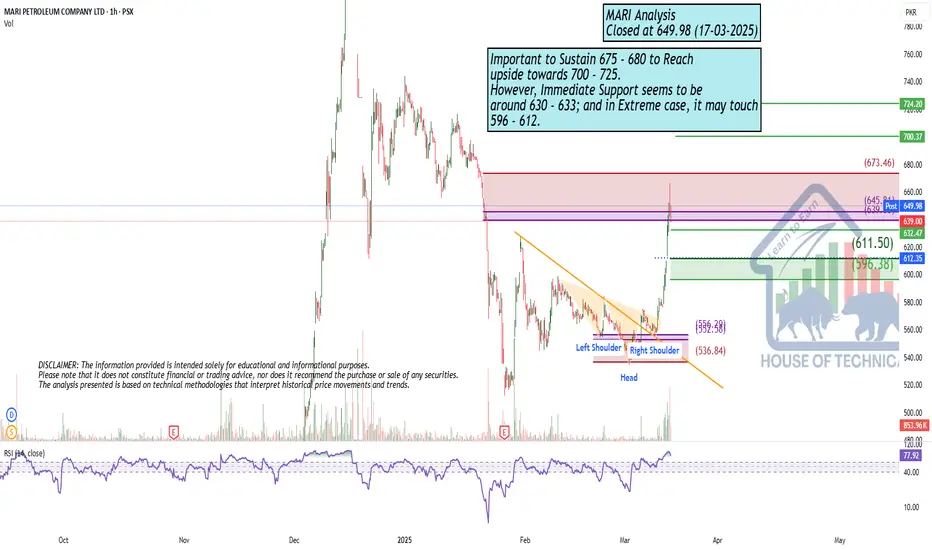
Still BullishImportant to Sustain 675 - 680 to Reach
upside towards 700 - 725.
However, Immediate Support seems to be
around 630 - 633; and in Extreme case, it may touch
596 - 612.
Mari-Nears Key Support – Potential Rebound Ahead?" ANSWER : YES
The price is approaching this trendline support, indicating a potential upward trend over time.

MARI ENERGYMARI Stock Analysis:
- *Bullish Movement:* MARI is showing a bullish movement.
- *Buying Opportunity:* Any weakness in the stock price is a buying opportunity, especially for new buyers.
- *Buying Range:* 600-580
- *Target Levels:*
- Initial target: 670
- Final target: 720
- *Stop Loss Strategy:* Use a trailing stop loss to lock in profits and minimize potential losses.

MARI - PSX - Beginning of a Bull Run MARI is the market leader of PSX. Historically, on time cycles it has shown consolidation period of 43 days before going into a bull run spanning around 32 days. Price after making the falling wedge has broken the structure upwards and now has even crossed the recent Lower High 627.40 as well - which signals a trend reversal towards bull run.
Very good volumes are also experienced which are also confirmed by KVO which is a volume-based oscillator (blue line is almost at 60 degree angle going up). RSI is at 70 without any sign of reversal. Therefore, it would be a fair bet that we might see another cycle of bull run which should cross the previous all-time high (900.23) calculated on the basis of AB=CD or Fib based Extension tool.
A minor retrace at key levels is expected where one should book profit.
Trade Values
Buy-1: 649
Buy-2: 630 (if price dips)
TP-1: 740
TP-2: 840
TP-3: 900
TP-4: 1030
SL: 535

MARI PROBABLY IN WAVE 'C' or '3' - LONGMARI is most probably in wave C or 3 which will be clarified will volume, as 3rd waves have the highest volume in general. We already have an active trade in this which I missed out to publish earlier but I'm doing my best to post it now.
If either wave C or 3 count is correct then we are heading up but as I've taught we should always have an alternate wave count and in this case the best alternate count is a wave B correction.
Wave B corrections can take any corrective pattern shapes therefore are very hard to pin point its wave count until it is completed, however the direction is still same but targets will get squeezed if its a B wave. Also the volume will not be as much of an impulse wave.
Let see how this plays, Good Luck !
Disclaimer: The information presented in this wave analysis is intended solely for educational and informational purposes. It does not constitute financial or trading advice, nor should it be interpreted as a recommendation to buy or sell any securities.

