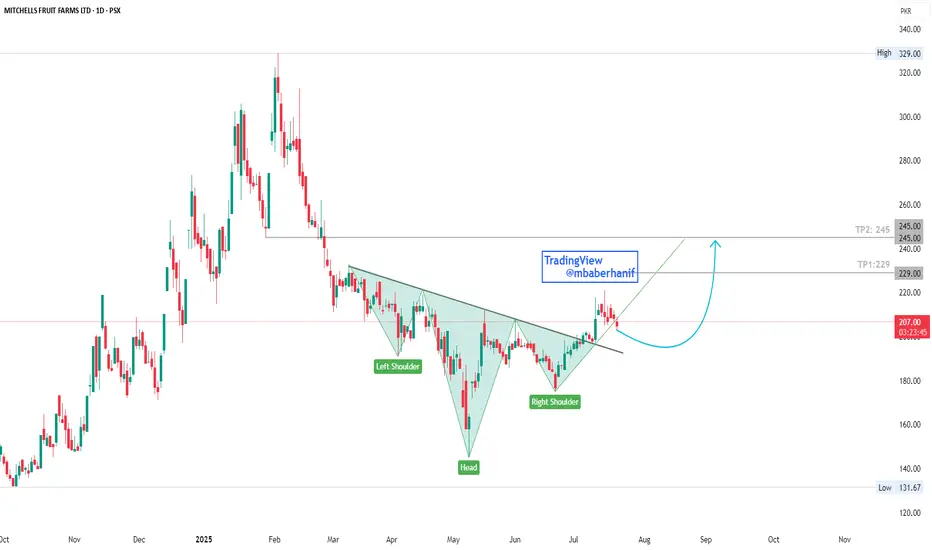
MFFL | Inverse Head & Shoulder Pattern📊 Technical Analysis Summary:
Pattern: Inverse Head and Shoulders
Left Shoulder: March 2025
Head: May 2025
Right Shoulder: June 2025
Neckline Breakout: Price has recently broken above the neckline, confirming the pattern.
Current Price: PKR 207
Support Zone: The price is currently retesting the neckline/support zone around 205–210.
Expected Move: A short-term pullback toward the neckline may occur before a bullish continuation.
Target Level: Based on the pattern projection, the target lies near PKR 229 and then 245, which also aligns with a previous resistance zone.
Trendline Support: A rising green trendline offers dynamic support, helping price structure stay bullish.
🟢 Bullish Signals:
Successful breakout from a bullish reversal pattern
Retest of neckline acting as potential support
Volume confirmation may further validate the move
🔴 Risk to Monitor:
Failure to hold above the 205 support zone might invalidate the breakout
Broader market weakness could impact the setup
Conclusion:
The chart presents a strong bullish setup with an Inverse Head and Shoulders breakout. A retest near 205 could offer a good entry with a potential upside toward 229 and then 245. Risk management is essential if price fails to hold above neckline support.
MFFL trade ideas
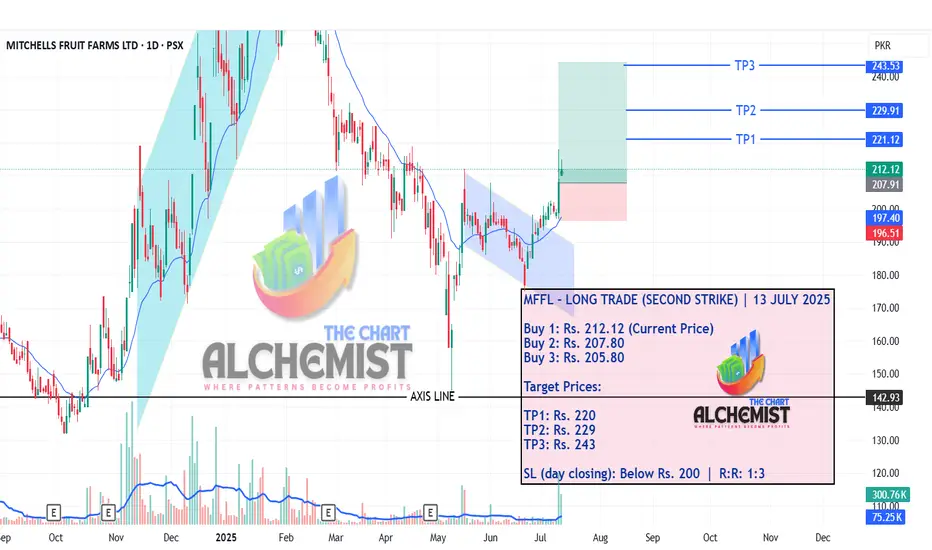
MFFL – LONG TRADE (SECOND STRIKE) | 12 JULY 2025MFFL – LONG TRADE (SECOND STRIKE) | 12 JULY 2025
After our previous buy call achieved its first target, the stock is currently positioned over a bullish structure, indicating potential for further upside. The present price position appears safe against downward action.
MFFL is in Rising ChannelMFFL is in Rising Channel, an entry may be taken on the breakout of the nearest resistance.

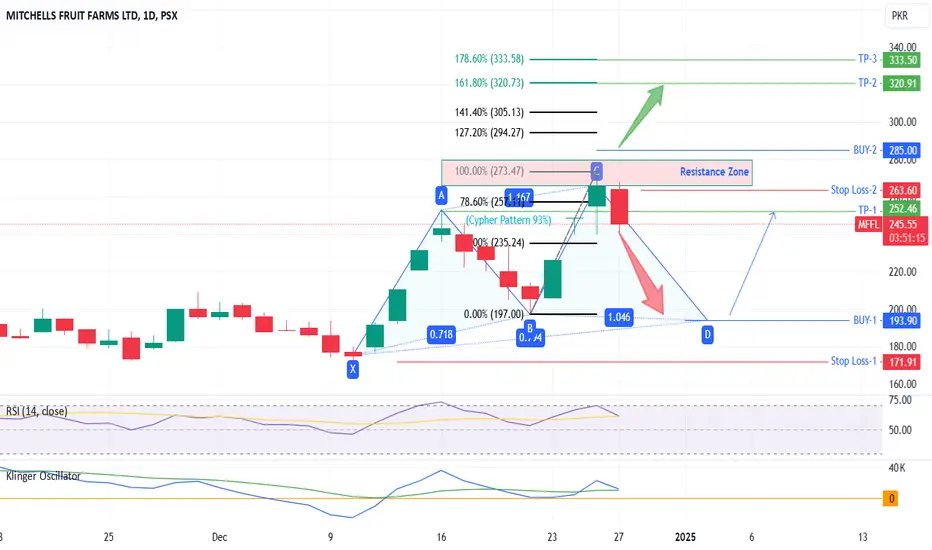
MFFL - PSX - Technical Analysis Bearish Cypher Harmonic PatternMFFL on daily TF, price has started to move downwards. It is following Cypher pattern and 93% chances are that it will follow it till price drops to 193~195. Additionally, RSI has also dipped close to 60 level and still going downwards. KVO also is dipping downwards but still above zero line; as soon as Blue line downwards crosses Green line price will start to drop sharply. If KVO dips below zero then selling pressure will be enormous.
Therefore, a cautious approach should be followed while getting in to it.
My recommendations would be to buy at dip of 193 and that too after analyzing it again as it may even slip to 120~130.
Alternatively, buying after it crosses 290 will be better approach as then it will be in the next bull run leg. TPs are calculated on Fib based Ext tool.
Trade Values have been marked on the chart.
MFFL - PSX - Long (Buy) Trade Call Seasonal timelines have been drawn on the chart. MFFL stocks have been seen historically going up in the month of October till first week of December i.e. for average 1.5 months and then going down. This happens because of the citrus export and selling locally as well. While from March till Aug it mostly relies on selling finished food products like jams.
Technically Fib retracement has already reached 0.89 level; besides bullish divergence has started to form on 4h TF. Price is about to reach a very strong support zone as well.
Therefore, it is strongly recommended to initiate instant buy at current market price and if it dips further to first support level then buy again. And if it falls even till the middle of support zone then buy third time as well.
Trade values are depicted below.
Buy Trade Call
Buy 1: 132.00
Buy 2: 129.50
Buy 3: 124.50
TP1 : 168
TP2 : 200
TP3: 250
SL: 115


MFFL - Buy Trade Call After retracing in a channel price is likely to reverse from here. Fib retracement 0.618 already touched and it may even touch 0.812 level.
RSI indicator is still bearish no prominent divergence, but it may reverse in a couple of days.
Technically very correct entry should be on break of parallel channel's upper line, however, if one wants to enter with better prices then here are the values.
Buy Trade Values
Buy 1: 144.00
Buy 2: 141.45
Buy 3: 135.00
TP 1 : 155
TP 2 : 170
SL: 127

MFFL🚀 Stock Alert: MFFL
📈 Investment View: Technically Bullish 📈
🔍 Quick Info:
📈 Entry Range: 163 - 164
🎯 First Target: 172
🎯 Second Target: 176
⚠ Stop Loss: 157.50
⏳ Nature of Trade: Short Term (Scalping Trade)
📉 Risk Level: Medium
☪ Shariah Compliant: YES
💰 Dividend Paying: NO
