OGDC Breakout?On a daily timeframe, OGDC has given breakout of a triangle pattern. This will open up doors for it to move towards its all-time high i.e. ~290 region.
This is my personal opinion, not a buy / sell call.
All other indicators e.g. RSI, Stoch and MACD are bullish as well.
OGDC trade ideas

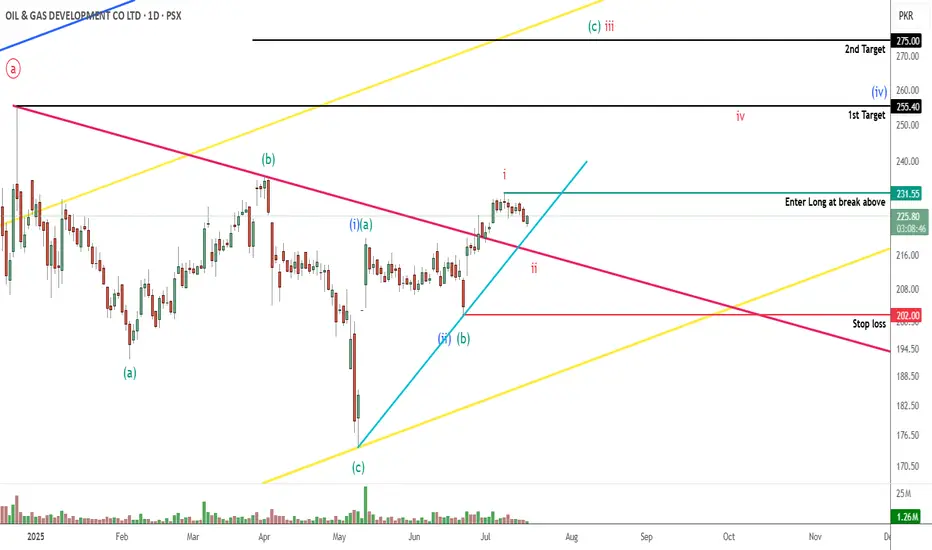
OGDC PROBABLY IN WAVE ' B ' OR ' C ' - LONGThis is in continuation to our ongoing tracking of OGDC wave structure.
If our wave count is correct then prices will take support from the 220-210 levels and will target the upside level of 255 and 275. Our wave count suggest that prices might even go above 300+ but that depends on how strong the bullish move is, if the move stays strong then price will target the upper yellow trendline.
Alternately, if price goes below the 202 level, it will take price well below 174.
We will buy 25% positions at 220-210 levels (ideally 218-216) and 75% at the break above 231.56
Trade Setup:
Entry level: 217 & 231.56
Stop loss: 202
Targets:
T1: 255
T2: 275
T3: Yellow trendline
Let see how this plays, Good Luck!
Disclaimer: The information presented in this wave analysis is intended solely for educational and informational purposes. It does not constitute financial or trading advice, nor should it be interpreted as a recommendation to buy or sell any securities.
OGDC PROBABLY IN WAVE ' B ' OR ' 5 ' - LONGOGDC is most probably in wave B or 5
Currently the price is forming a flag pattern as minor wave b or 2 which might continue to build this week. As per our preferred wave count we are only looking to buy OGDC once it breaks above the flag formation.
Last minor swing high is at 213.50 at the moment therefore we will enter at 213.60, however as the pattern might continue to build it can make new swing low and high therefore if the flag pattern stays intact then we will use the next minor swing high for entry accordingly.
Currently we are targeting 235 area, however if the pattern continues to build we will modify the target as well.
Alternately, if the prices go down and breaks the flag pattern this trade setup will get invalid
Let see how this plays, Good Luck!
Disclaimer: The information presented in this wave analysis is intended solely for educational and informational purposes. It does not constitute financial or trading advice, nor should it be interpreted as a recommendation to buy or sell any securities.

OGDC SHORT TRADEODGC is continuing on its bearish trajectory, it tested its recent breakdown level today around 208
SHORT OGDC 202-206
TP 194
SL 209

Bullish on All Time Frames.Bullish on All Time Frames.
Monthly Closing above 211 - 212 would
be very positive for OGDC.
Retested the Previous Breakout Level
around 194 - 195.
Hidden Bullish Divergence on Daily Tf.
227 - 228 is the Weekly Resistance that
seems to break this time.
If this level is Sustained, we may witness
250+ initially.

OGDC - LongFrom a technical point of view, the first target should be Rs 237, and the long-term target is Rs 335.
On fundamental grounds, the current fair value of this share should be around Rs 228, but if the circular debt issue is resolved and the company starts giving dividends around Rs 40 - Rs 45 than the fair value will jump to around Rs 350, so it is a good bet both technically and fundamentally.
Do your own research(DYOR)

OGDCOGDC Analysis
Currently at channel top if breaks 224 and sustained then will go further up
No any Negative sign in Daily/Weekly


OGDC-LONGstrong fundamental stock standing on its support and Lower trendline it can bullish from here and
moves upward upto its target o upper trend line a golden chance of 90-100 % return

OGDC - PSX - Buy Trade CallOGDC has been sideways after making a HH and even broke its regression channel. It has now made a bullish hidden divergence on RSI.
Although KVO is still down but it is anticipated to gain momentum due to good news coming up from OGDC management.
Trade Values:
Buy-1: 214 (Current Market Price)
Buy-2: 209.00 ~ 209.50 (on dip)
Buy-3: 237 (Technically a correct entry for those who wants to wait to establish bull run.)
SL: 189
TP-1: 235.35
TP-2: 255.38
TP-3: 270.21

OGDC is SUPER BULLISH long term.OGDC is SUPER BULLISH long term.
OGDC is bullish on long term investment and can be multiple X value from current price.
However, price never move in a straight line, therefore currently we will focus on nearest mid term (3-5 years) targets, after which OGDC shall strongly consolidate.
At present the midterm target lies between 550-700, that can be achieved by two possible pathways as indicated on chart.
Currently the accumulation zone lies roughly between 100-200 and can be considered as last opportunity to buy in this zone for mid-term and long-term investments.
GOOD LUCK
DISCLAIMER:
The information provided doesn't guarantee results. 𝙏𝙧𝙖𝙙𝙞𝙣𝙜 𝙞𝙣 𝙛𝙞𝙣𝙖𝙣𝙘𝙞𝙖𝙡 𝙢𝙖𝙧𝙠𝙚𝙩𝙨 𝙘𝙖𝙧𝙧𝙞𝙚𝙨 𝙧𝙞𝙨𝙠𝙨. Individuals should perform a thorough analysis and consider their risk tolerance before making investment decisions. 𝙄 𝙖𝙢 𝙣𝙤𝙩 𝙧𝙚𝙨𝙥𝙤𝙣𝙨𝙞𝙗𝙡𝙚 𝙛𝙤𝙧 𝙛𝙞𝙣𝙖𝙣𝙘𝙞𝙖𝙡 𝙡𝙤𝙨𝙨𝙚𝙨 𝙧𝙚𝙨𝙪𝙡𝙩𝙞𝙣𝙜 𝙛𝙧𝙤𝙢 𝙖𝙘𝙩𝙞𝙤𝙣𝙨 𝙗𝙖𝙨𝙚𝙙 𝙤𝙣 𝙩𝙝𝙞𝙨 𝙥𝙤𝙨𝙩. Consult with a qualified financial advisor before entering to trade in stocks

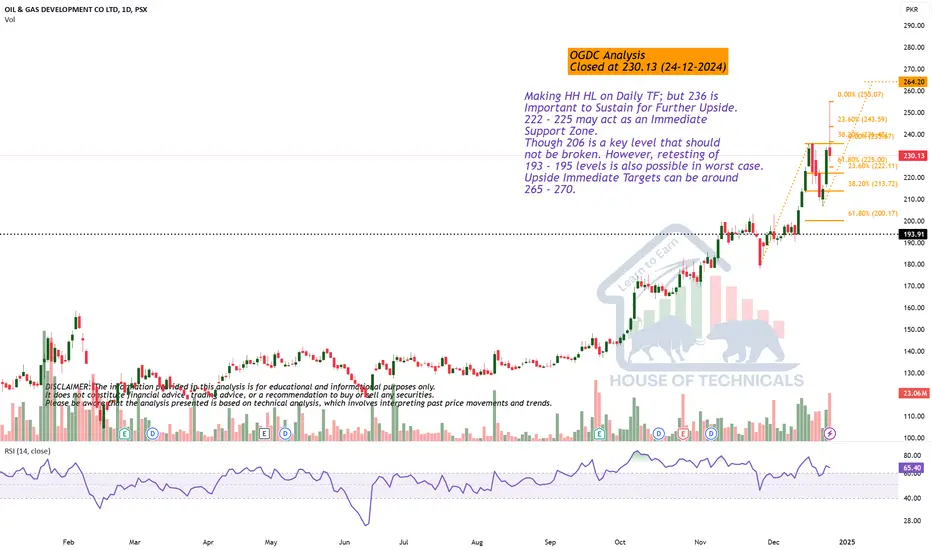
Making HH HL on Daily TF; butMaking HH HL on Daily TF; but 236 is
Important to Sustain for Further Upside.
222 - 225 may act as an Immediate
Support Zone.
Though 206 is a key level that should
not be broken. However, retesting of
193 - 195 levels is also possible in worst case.
Upside Immediate Targets can be around
265 - 270.
OGDCOGDC making HHs and HLs, initial resistance lies around 236 which consider the initial target and upon break out next resistance lies around 280.

OGDC all Targets achieved !Initiated a call in Sep'24 for potential Target of 190 on the breakout of symmetrical triangle and breakout of previous LH which was achieved on 8 Nov'24. given swing traders approx 35% gain within 2 months.
The stock is likely to continue its bullish momentum and might test its first resistance at 244 and second resistance at 265. However, those who wish to ride should place SL @ 177 so that all gains are not eroded.

OGDCOGDC breaks its previous resistance, which acts as support for the price.
Expected 40% bullish wave is expected in upcoming days!

OGDC : AB=CD PatternOGDC: An ABCD pattern on the daily chart suggests a potential bullish move toward Point D if the price sustains and closes above Point B daily. Stop loss is at Point C.

OGDC 29 Nov 2024 ZonesBullish zone 195.5
Bearish zone 192.5
Key levels are 208, 201, 187 and 180
Note: This is not a buy/sell call. Use stop loss whenever trade.

OGDC 27 Nov 2024 bullish and Bearish ZonesBullish zone is above 183.25
Bearish Zone is 175.5
Note: This is not a buy/sell call. Use stop loss whenever trade.

OGDC drop down and bounceback levelsThese are key levels of OGDC for drop down and bounceback.
Note: this is not a buy/sell call. Trade at your own risk.

OGDC drop down and bounce back levelsThese are #OGDC drop down and bounce back levels.
Note: Trade at your own risk.

OGDC. Bullish channel Top with Divergence- Bullish Channel
- Channel Top Retest
- Rejection seen from top of channel
- Divergence appeared
- Retracement Expected
- A Healthy Retracement level is around
38% to 50% fib level
- Horizontal Support level Aligns with retracement
level

WIP: WORK IN PROGRESSI'm still not finished with my analysis. I'll refactor / update it over the weekend, & then I'll add detailed description . Currently, I'm too much busy with office work. This is just a draft for review on the coming weekend.
