PIOC SHORT-SELL/EXIT CALLPIOC has been in an uptrend since Jan 2023. It made a Scallop formation and gave breakout from that formation in March 2024. It has exactly achieved the target price as projected by measured move. (TP 236), It has now formed a double top with right top lower than the left top. Though targets from the measured move projection of double top are much bigger, but those will be shared at later stage.
🚨 TECHNICAL SHORT-SELL/EXIT CALL – PIOC 🚨
🎯 SHORT-SELL/EXIT ZONE: Rs. 210-220
📈 TP1 : Rs. 195
📈 TP2 : Rs. 175
🛑 STOP LOSS: ABOVE Rs. 234 (Daily Close)
NOTE – Prices are of ready market
📊 RISK-REWARD: Medium Conviction | 1:2.7
Caution: Please enter/exit in 3 parts in give range. Close at least 50% position size at TP1 and then trail SL to avoid losing incurred profits in case of unforeseen market conditions.
PLEASE BOOST AND SHARE THE IDEA IF YOU FIND IT HELPFUL.
PIOC trade ideas

Bearish Divergence on Weekly TF.Bearish Divergence on Weekly TF.
Resistance lies around 225 - 235
Currently moving in a Rectangular Channel.
Crossing 222 - 223 will trigger more positivity
towards 235 - 240 initially and then around 250-260.

Short term trade in PIOC , H1 time frameBuy PIOC@ 220, near trendline support , for TP @220 and stoploss below 295

PIOC on the movePIOC needs to be watched and placed on watchlist as it is anticipated that its going to give a good move towards the upside. It is approaching EMA50 and EMA100 from below and a crossover of the two EMAs is about to take place soon, hopefully.
Daily RSI-14 has jumped upwards after touching min 36.84 to the current 50.18 and a positive crossover has taken place on the MACD, though it is yet to cross the Zero Line towards the upside on the DTF. Lets c how it plays, further.
Potential Targets given on chart. There is a falling wedge Target approx. @ 250-255.
Wish you all Happy Trading 📈

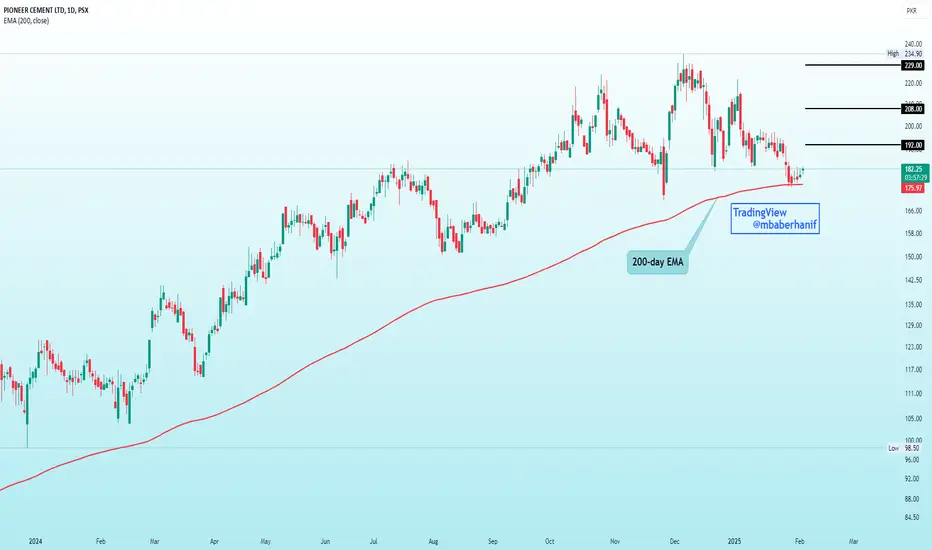
PIOC Respecting 200 EMAPIOC has experienced a pullback after testing the 200-day EMA and is currently trading 3.60% above it. Notably, the stock has been in an uptrend since March 2023, consistently hovering above the 200-day moving average. An initial target of approximately 192 is anticipated in the coming days. If a breakout occurs, the price may advance towards 208, with a potential test of its previous high around 229 from a swing trade perspective. A stop-loss is recommended if the stock falls below the moving average, as this would indicate a shift toward a downward trend.
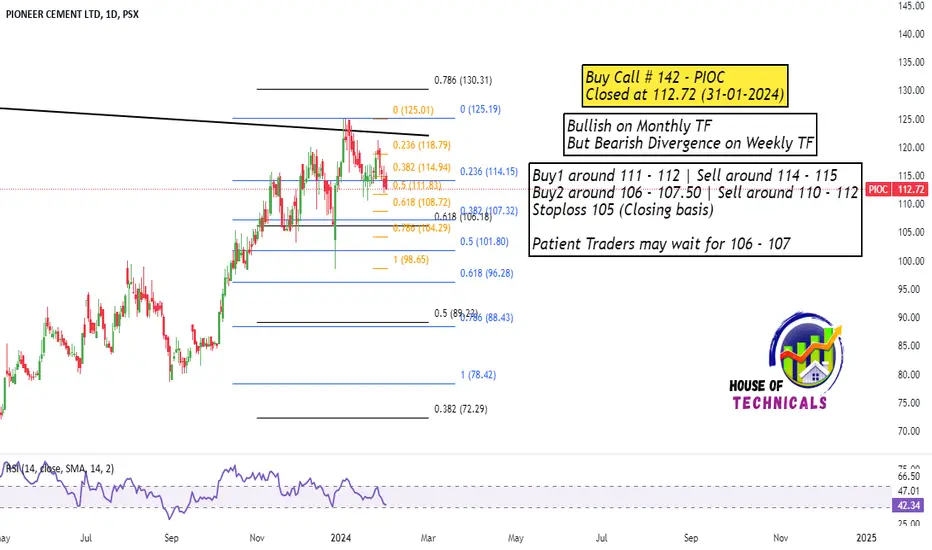
PIOC still offers 14-15% gainAnother 14-15% gain is remaining in PIOC as per the curve the stock had broke out the curve in April'24 at a price of Rs. 145.
The final leg of the curve projection is expected to be touched maximum by Feb'24 with a Target price of 250. SL can be placed at 170. Entry can be made at 210 to take an RR of 1:1

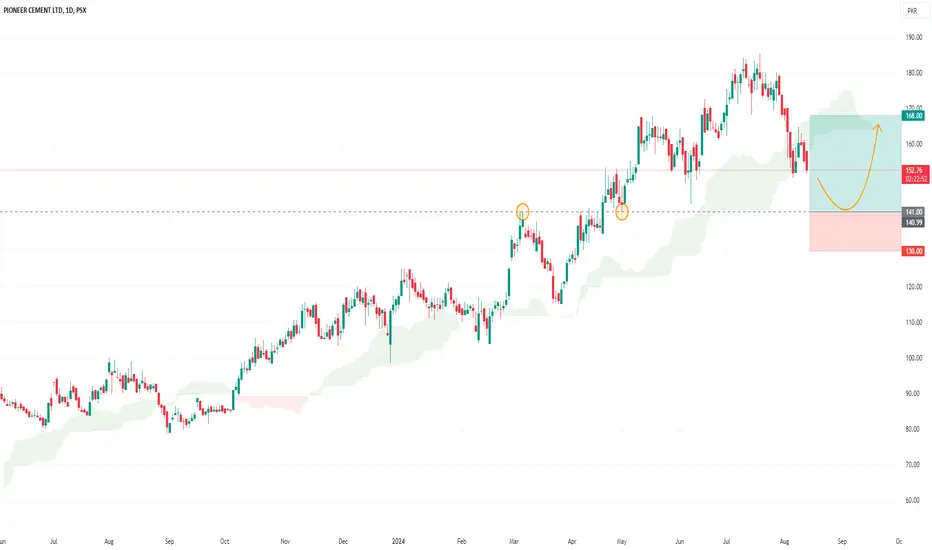
PIOC | Swing Trading SetupPIOC is currently trading at 153, and several technical indicators suggest a bullish reversal is imminent, presenting a strong buying opportunity. The Relative Strength Index (RSI) has recently dipped at 30 and currently at 35, indicating the asset is oversold and may soon experience upward pressure as buyers step in. Moreover, bearish divergence from its top of 185.40 price is observed which pulls the price downward. Additionally, the Moving Average Convergence Divergence (MACD) histogram is showing a waning bearish momentum, with MACD line poised to cross above the signal line, which historically signals a potential buy.
Moreover, the price action may face support around 141 level, a classic reversal pattern that often precedes a bullish breakout. This support level has held firm previously. The 200-day Exponential Moving Average lies at 137.60. The stock start rejecting from the top of 185.40 and currently at 91% oversold level which indicated a possible pull back can be expected from support zone. Lower Bollinger band level lies at 148.64, while middle and upper lies at 167.75 and 186.87 respectively.
Forecast:
In the near term, the script seems to target around 163
In the medium term, the script seems to target around 168
Recommendation:
It is recommended to consider initiating buying positions near 141 and set stop loss below 200-day EMA around 130.
Risk & Reward Ration= 1 : 2 (for first target of 163)
Risk & Reward Ration= 1 : 2.45 (for second target of 168)
Disclaimer: Do your own research before taking position.
Doji Candle is formed on Monthly TF.
Bullish on Monthly TF.
Making HH HL on Daily TF.
But Bearish Divergence on Daily TF.

PIOC-ShortAfter breaking weekly resistence, POIC is in bullish
As POIC create it HH and now it will come down to create another LH
further volumes are also shrinking
Short
TP Rs.169

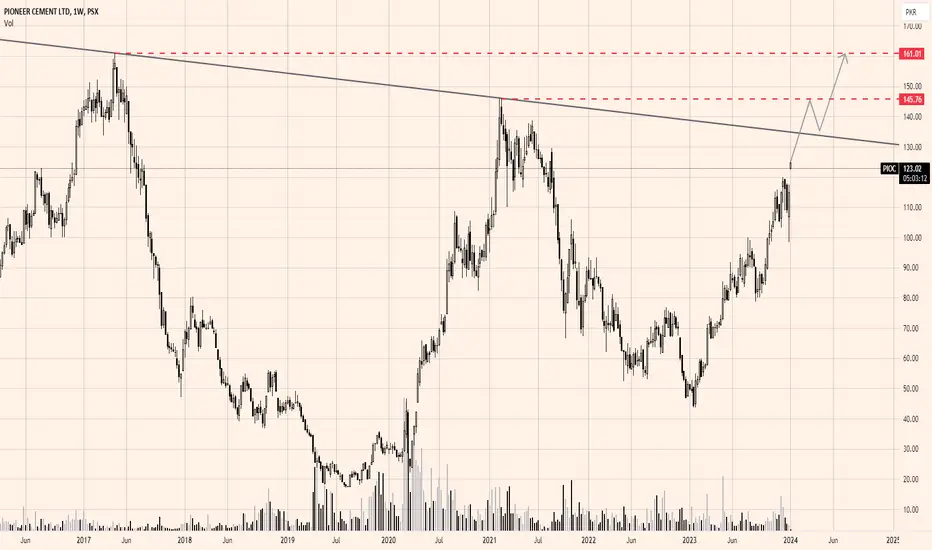
PIOCPIOC is shows bullish momentum in weekly time frame. Break above of the trend line can test the price at 145.76 from where rejection can be seen. If bullish momentum continues then it can test next resistance at 161.
PIOC - HEAD & SHOULDER PATTERNPIOC FORMED AN HEAD & SHOULDER PATTERN, bearish move is expected in coming days, short entry recommended in PIOC.

Bullish on Monthly as well as Weekly TF
No Bearish Divergence Yet
ABCD pattern completes around 330 - 335
Making HH HL on Weekly TF

PIOC - BEARISH CONTINUATIONPIOC - Closed below the imminent resistance level @ 123 indicates the more pressure ahead leading towards crucial support lies around the 109 level, Any break below could extensively sell off further towards 104 - 96 levels.


PIOCThe price action is moving in an ascending parallel channel and gives closing at 124.94 in the last trading session. First support lies in the range of 121-120 and second support around 110-112. If it sustains the support zone then buying opportunities will establish. On the flip side, resistance lies around 129.50, sustaining above can pull the price towards more upward towards 137.70. Close below 103 establishes a bearish momentum


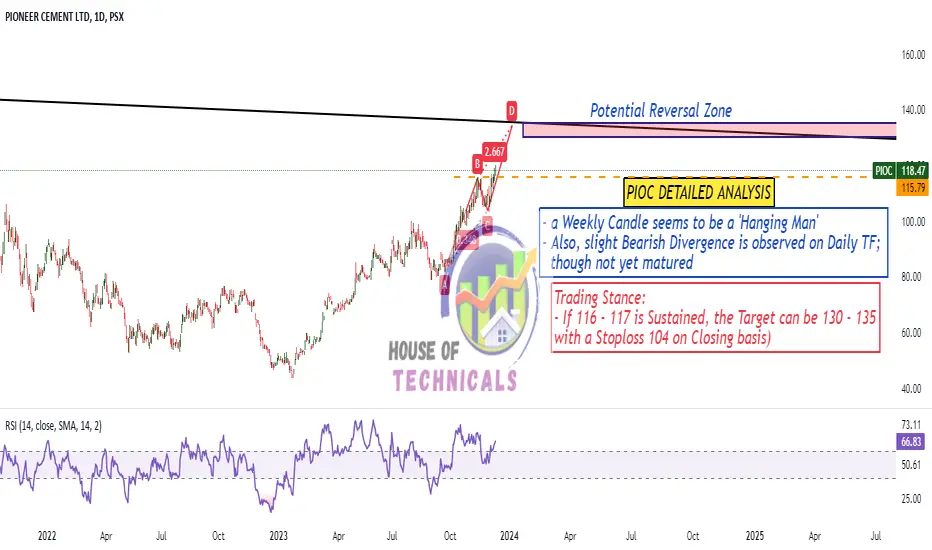
PIOCTrading Stance:
- If 116 - 117 is Sustained, the Target can be 130 - 135
with a Stoploss 104 on Closing basis)
PSX: PIOC LET'S JOIN THE TREND.Pioneer Cement Co. is a cement manufacturer in Pakistan.
Recently it gained a price hike in a smooth uptrend. It has been in retracement and it is showing the signs of reversal.
If it reverses from here the medium term target shall be 142. Whereas in short term the resistance it shall be facing shall serve as the TPs.
Our cautious friends may initiate trade at 116 for others enter the trade when it suits your style.

PIOC - BULLISH CHANNELThe cement stock is trending inside a well defined Bullish Channel indicating continuation of the trend. There is no divergence on RSI . Long Positions may be looked for.

PIOC Chart PIOC in a corrective move likely to develop regular or running flat afterwards it may resume uptrend wait for the completion of corrective move how it unfolds.
