POL PROBABLY IN WAVE '' C '' OR " 3 " - LONGThis is in continuation of our ongoing tracking of POL wave structure.
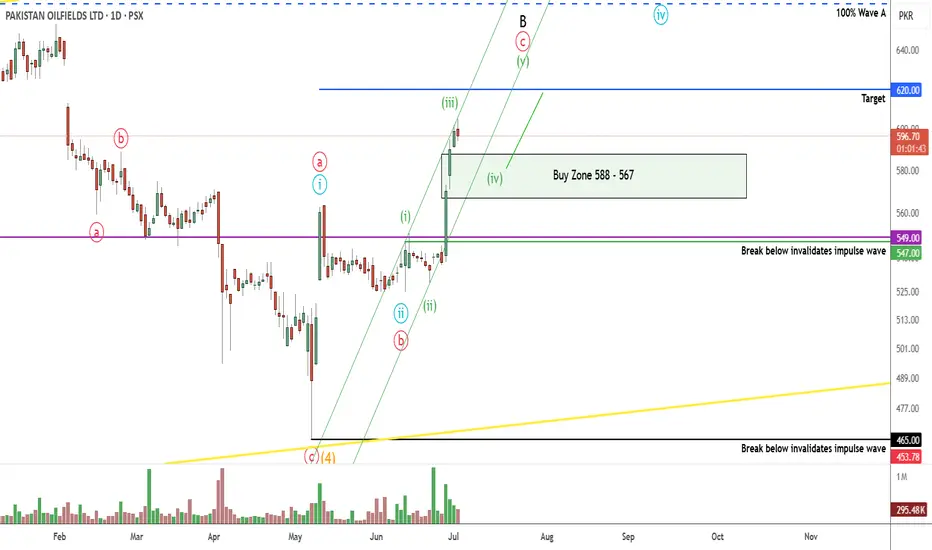
POL is currently in C or 3 which will target the 620-623 or 680 level. Our preferred wave count is C and we will target the 620 level. If our wave count is correct then prices will decline to our buy zone of 588-567 range as wave 4.
Alternately prices will never go to our buy zone and will reach the 620 - 623 level directly making this trade setup as void.
We will buy in portions at 588 > 580 > 576 level
Trade setup:
Entry price: 588 - 567
Stop loss: 547
Targets: 620 - 623
Let see how this plays, Good Luck!
Disclaimer: The information presented in this wave analysis is intended solely for educational and informational purposes. It does not constitute financial or trading advice, nor should it be interpreted as a recommendation to buy or sell any securities.
POL trade ideas
POL PROBABLY IN WAVE '' A '' OR " B " - LONGThis is in continuation of our ongoing tracking of POL wave structure.
Prices went below our buying zone of 475 touching 465, taking a cautious approach as the overall market was down, we did not buy at 475-465 area and waited for a bounce up for confirmation. Now the bounce has been significant and if our wave count is correct then we are most probably in wave 4 of an impulse wave of A or B.
This trade setup remains valid until 505 is taken out.
Trade setup:
Entry price: 545 - 530
Stop loss: 504
Targets: 575 - 590
Let see how this plays, Good Luck!
Disclaimer: The information presented in this wave analysis is intended solely for educational and informational purposes. It does not constitute financial or trading advice, nor should it be interpreted as a recommendation to buy or sell any securities.

POL LongAfter a 50% retracement post its all-time high break and making a new all-time high, POL is set to fly again, consolidating before flying high again. Target is 1100+ as shown in chart. This is not a buy/sell call, just speaking my mind out.

POL LONG TRADEPOL LONG TRADE
POL is in uptrend on 1W chart (yellow channel) since end of 2015. Within this channel, it is now following an upward trend line (blue dotted line) since Oct 2022.
It touched the top of the 1W channel in Dec 2024 and started its Downward leg (pink channel).
If we zoom into lower TF (1H - upper window), POL has broken out of this downward channel in a Spike & Gap Fashion with sufficient Volume Gradient creating a Bullish Breaker Block and FVG.
Trade is considered low risk at this Juncture.
🚨 TECHNICAL BUY CALL – POL 🚨
BUY1: 527
BUY2: 524
BUY3: 521
📈 TP1 : Rs. 552
📈 TP2 : Rs. 574
📈 TP3 : Rs. 596
🛑 STOP LOSS: BELOW Rs. 510 (Daily Close)
📊 RISK-REWARD: | 1:3
Close at least 50% position size at TP1 and then trail SL to avoid losing incurred profits in case of unforeseen market conditions.
PLEASE BOOST AND SHARE THE IDEA IF YOU FIND IT HELPFUL.

POL - PSX - Buy IdeaPOL 4H chart shows a potential bullish setup, with divergence between price and RSI. Price is retesting the breakout zone around 530. Look for Buy with SL below 490 and take profit at 640. RSI holding above 50 also shows bullish momentum.

POL PROBABLY IN WAVE 'A' OR '1'This is an update on our POL wave count shared earlier, we have modified the wave count looking at the formations and excluded the possibility of the current wave being a wave C.
If the wave count is correct then we are in 5 or Y of wave 1 or A.
With reference to my last idea of POL in which we got greedy and took a loss on 50% of our positions and are still holding 50% of the long positions for long term. Since are preferred wave count is still showing some downside which can reach 500-475 range and even further, It is not wise to just let our investment sit there and wait for the upward movement which can take months from now. Therefore we have decided to hedge our current position with a small portion of short sell in POL futures.
Will share the short sell trade setup tomorrow morning
Let see how this plays, Good Luck!
Disclaimer: The information presented in this wave analysis is intended solely for educational and informational purposes. It does not constitute financial or trading advice, nor should it be interpreted as a recommendation to buy or sell any securities.

POL PROBABLY IN WAVE 'C' OR 'A' This is an update on our POL wave count shared earlier, we have modified the wave count looking at the formations.
If the wave count is correct then we are in an ending diagonal which is either complete or in the last leg of completion, we will buy once price breaks above 575.
Alternate count is that of 5th wave will get extended downwards, however that probability is low that is why we have removed our short sell trading setup.
Although possibility of the downside is still there, the formation of double top chart pattern and our weekly crude oil wave count does support downside long term.
There's a correlation between international crude oil prices and Oil & Gas exploration sectors, however currently the markets have not been correlating much but on the long run prices will tend to correlate.
Let see how this plays, Good Luck !
Disclaimer: The information presented in this wave analysis is intended solely for educational and informational purposes. It does not constitute financial or trading advice, nor should it be interpreted as a recommendation to buy or sell any securities.


POL PROBABLY IN WAVE 'C' OF CORRECTIVE PATTERN DOWNPOL is most probably in a corrective wave down which has started after a strong impulse wave up. Currently the market is in wave C of the corrective pattern downwards.
As per our prefer count, on the minor level we are currently in the 5 wave of Wave C, which is either complete or will get extended further down. Once the price closes below 549 it will open targets for wave 5 extension levels as per Elliott wave rule. Also in addition it will give confidence in the Double Top pattern and we can use the chart pattern as well to determine the targets. Remember volume is the key indicator here.
On the other hand if the wave 5 of Wave C is over, then we are in 1 or A wave of an impulse or corrective wave up. The formation of the wave will help us determine the upside targets if price does break above last swing high.
Let see how this plays, Good Luck !
Disclaimer: This is for informational purposes only; anyone taking trades using this idea will be liable for their own profit or loss.


POl Bullish In PSX POL ( Pakistan Oilfields Limited) iss touching and closing above trendline.
Wee are still bullish in this scrip with first target of 699.
Even though its Quarterly result was not up to the mark but it is still very strong scrip.
Bullish.

POL with 14% gains Entry can be taken when the price sustains above 698 of the curve formation projections of which will raise to the Target of 850+ which would be the gain of 21%+
Planned entry: 698
Target Price is around 846
Stop Loss 549

PolAnother e&p stock coming out of a big base. After false breakout it seems like it can perform well from here. So far it's lagging behind it's peers

POL-UPTRENDAfter accumulating POL is currently in an uptrend ,long entry is recommended from this point.

Morning Star at HH on Weekly TF.
Still Bullish on All Time Frames.
However, Bearish Divergence is there
on Daily TF.
Monthly Closing above 598.50 would
be a Positive Sign.
If someone is in the trade, 574 should be
the Stoploss.

Pol short tradePol abhi lain
620 confirm take profit
623 next level but b carefull
I am buying on current 617 Nd exit on 620

POL - Preparing for DownfallPOL is currently in uptrend and forming rising wedge pattern. It is also showing a bearish divergence. It may fall after breaking lower trend line and possible short opportunity after breaking previous higher low. Stoploss would be recent high.

Pakistan Oilfields Limited (POL) Chart AnalysisPattern Identification
The pattern visible on the POL chart is indeed a Symmetrical Triangle pattern. Symmetrical triangles are neutral patterns that can break out in either direction.
Key Features
Symmetrical Triangle:
The upper trendline is descending, and the lower trendline is ascending, forming a symmetrical triangle.
Breakout above or below the trendlines indicates the future direction.
Fibonacci Retracement Levels:
The chart shows Fibonacci retracement levels which help in identifying potential targets post-breakout.
Resistance and Support Levels:
Resistance: Around PKR 500.00 and PKR 602.42.
Key support levels: PKR 432.85 (38.2% retracement), PKR 380.46 (50% retracement), PKR 328.08 (61.8% retracement).
Current Price Action
The current price is PKR 500.00, at a significant resistance level.
Future Forecasting
Bullish Scenario:
If the price breaks above the resistance level of PKR 500.00 with strong volume, the next target could be around PKR 602.42.
Sustained move above this level could indicate strong bullish momentum.
Bearish Scenario:
If the price fails to break above the resistance and starts declining, it could retest the lower trendline of the symmetrical triangle.
Breakdown below this trendline would indicate a bearish scenario, with potential targets around PKR 432.85, PKR 380.46, and PKR 328.08.

POLPlan1
Buy Above 434
TP1 around 446
TP2 around 453
Stoploss 426 (Closing basis)
Plan2
Buy Above 465
TP1 around 500
TP2 around 542
Stoploss 432 (Closing basis)

POL - RSI reached its highest value in the last 14 sessionsPOL - RSI reached its highest value in the last 14 sessions - Bullish
The Price heading towards its recent high @ 456
