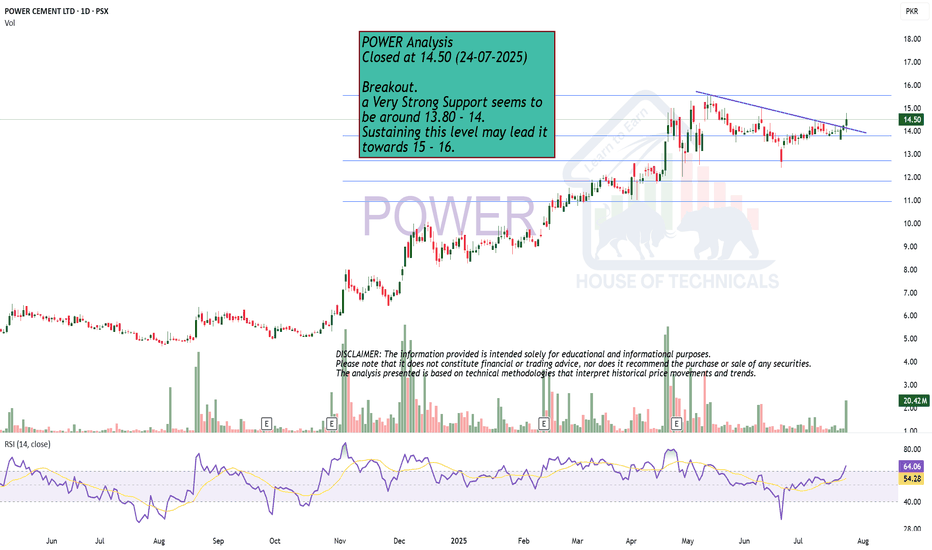
POWER trade ideas
POWER SHORT TRADEPOWER went through Buying Climax on previous Up Leg with 144M, latest Up Leg has drastically lower volumes 55M , conversely volumes on Down Leg have increased. Power has gone through Shortening of Thrust and also Up thrust or Bull Trap as per Wyckoff Methodology, it is expected to embark on major downtrend with immediate target 12.10
SHORT POWER 14.3 - 14.6
TP 12.1
SL 15.35
Bullish on All Time Frames; butBullish on All Time Frames; but
Strong Resistance lies around 12 - 12.20
Those who are Holding, Must Trail their
Stoploss to 10.30 (at least)
Though there is Hidden Bullish Divergence, but
Strong Resistance is lying ahead.
Those who want to Take Fresh Entry, should
wait for 12.20 to Sustain.
One thing to note is a Bearish Divergence on
Daily TF. But since this is on Daily TF, so slight
Pressure may bring buying Opportunity (as long as
it stays above 8.)
POWER - PSX - Tech AnalysisPower after the pressure of selling has started to recover.
Price is just under the 8/1 resistance line of upper Gann fan. Once price crosses it then this line will start acting as support. Just see the repetition of the triangle pattern (Orange).
RSI is also moving upwards and at present it is around 57, therefore, there is sufficient room to consider retracement which previously happened at 75 and 86 respectively.
KVO is just below zero level but likely to catch up.
Trade Values
Buy Mkt: 9.20
TP-1: 9.96 (Price Action Resistance)
TP-2: 11.80 (AB=CD)
SL: 8.20 (below previous HL)
POWER CEMENT PERFECT SETUP FVG + HIGHER HIGH RETEST AND BREAKOUTPower cement fair value gap plus higher high retest at 9.75. also, there was an accumulation box on the higher time frame. the liquidity was resting in the higher high retest in the fair value gap. the stock absorbed all the liquidity at 9.75 and gave a breakout at 10.30, rallying quickly 8 percent in 2-3 hours. that’s how the smart money and the big institutes play!!
POWER - PSX - SWING Trade - Technical AnalysisOn Monthly TF, Cypher Harmonic Pattern has been drawn.
Although, point C has not extended till minimum text book requirement of 1.172 but anyway in real world some exceptions can be taken when no other pattern is matching.
Point D has been drawn to arrive to the TP from where a reversal is expected.
EMA 21 is below the candles indicating a Bull run.
On Daily TF, price is under upper limit of Bollinger Bands which indicates that steadily price is going up and up. However, a retracement to establish a Higher Low is eminent. Therefore, do not worry if price retraces a bit. Remember this analysis is for Swing trading not for day trading. Stop Loss has been assigned based on the HL on Daily time frame.
Swing Trade Values which may last for 2 to 4 months:-
Trade Values
Buy (Mkt): 9.39
Stop Loss : 6.45
TP-1: 12.00
TP-2: 16.00
POWERPOWER - Buy Call
Entry: 5.21
Target: 5.51 (5.7%)
Stop Loss: 4.96
Stock Summary : POWER closed at 5.21 and is currently holding below the 20-day SMA on the daily chart. The stock finished 4.42% above the lower Bollinger Band. Upper band lies at 5.64. POWER tested an upward trend line in the last trading session and successfully closed above it, establishing positive stance. The 200-day SMA lies around 5.51 which consider the initial target of the price. Upon breakout further upside can be expected.
Recommendation : Initiate buying positions on weakness or near the support zone and set stop loss below 4.96.


