PPL trade ideas

PPL is currently changing its trend , possibility of upward movement from this zone
long entry is recommended

PPL - BULLISHPPL was bearish trend on 15MIN chart,
after printing divergence there's a possibility of good gains from this zone
long entry is recommended

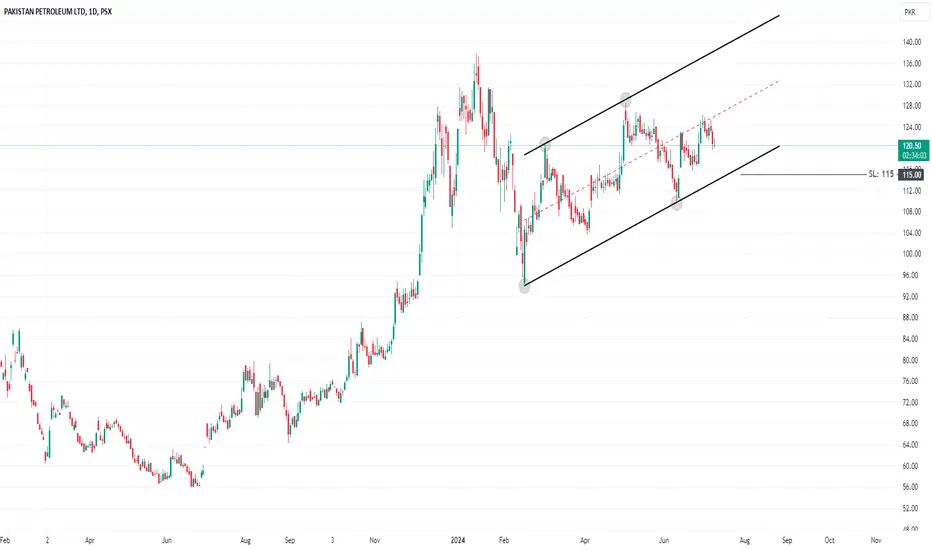
PPL | Parallel Channel FormationThe price action is following in a parallel channel. Lower channel range lies around 117.50 from where a possible pull back can be expected. For swing trading setup, long position can be consider on the test of lower parallel channel with the stop loss at 115 and possible target for long term can be expected around 130. On the other hand, the price is making higher highs and higher lows within the channel, so scalping trade can be possible with entry around 120 for the target of 125 and 128.
Swing Setup:
Entry: 117.50
Target: 130
SL: 115
Scalping Setup:
Entry: 120.50
TP1: 125
TP2: 128
SL: 119
PPL Analysis 2.0🚨 Trade Alert: PPL Bearish Harmonic & Flag Pattern 🚨
We have identified a bearish setup in PPL, marked by the following patterns:
Bearish Harmonic Pattern 🐻
Bearish Flag Pattern 🚩
Technical Indicators:
No divergence is present, confirming the bearish outlook. Additionally, PPL is printing Lower Highs (LH) and Lower Lows (LL).
Entry Point:
Place a sell stop at 117.00.
Target Price (TP):
TP: 112.00 📉
Stop Loss (SL):
Place your stop loss at 121.88 to manage risk.
Trade Summary:
Sell Stop: At 117.00
TP: 112.00
SL: 121.88
Trade Type: Short Swing 📉
Good Luck! 🍀
Stay informed and trade smart! 📊

PPL🚀 Stock Alert: PPL
📈 Investment View: Technically Bullish 📈
🔍 Quick Info:
📈 Entry Range: 115 - 116
🎯 Targets : 127
⚠ Stop Loss: 107
⏳ Nature of Trade: Short Term (Scalping)
📉 Risk Level: Medium
☪ Shariah Compliant: YES
💰 Dividend Paying: YES
📰 Technical View: An apparent deviation from the upward trend line is noticeable on the chart. Additionally, the formation of a head and shoulders pattern may occur if the price reaches 127 and displays a rejection at that level. A potential trading opportunity arises within the range of 115-116, aiming for a target of 127 corresponding to the right shoulder of the pattern. To manage risk, it is recommended to set a stop loss just below the neckline break, approximately around 107.

PPL | Rising Oil PricesBreak out from the trend line is observed in PPL, two step buying is recommended in this stock. Can be consider at current price around 113 and at the retest of the lower trend line around 107. Following are the resistance levels:
R1: 120.90
R2: 127.80
R3: 137.90
Use stop loss if breaks previous low of 103.60.

PPLWe can attempt to buy PPL from specified level as 0.5 FIB intact , also there is no bearish divergence occur at current levels.
SL , TP mention in chart.

PPL (Intraday/Short Swing).PPl is bullish as it is making HH, and HL.
concerning channel PPl enters daily Uptrend channel.
short 2hrs channel PPl took support from the bottom and now trading somewhere in the mid.
If crosses and sustains 115.5 then buy and place sl below 114.
sell at 117-118.

Chart 4- PPL Bearish trend continues Pakistan Petroleum bearish trend continues since first week of March 2024.

PPL -BearishPPL is showing downwards trend, making Lower Highs and Lower Lows , printing bearish candlesticks which indicates a bearish trend.

PPL is BullishPPL is currently bullish as it has printed a higher high and would soon define a higher low before moving to new highs. Targets are mentioned on the chart.


Possible short tradeI am expecting for stocks to fall after a certain rise. Mostly due to economic situation. It might rise a bit about 106.56 but you can short it from there and aim for 2:1 profit risk ratio. Let see how it unfolds.
Beauty of the market is uncertainty!!!


If 106 is Not Sustained, we may witness 93 - 94Buy1 around 106 - 106.70 | Sell around 110 - 112
Buy2 around 93 - 94 | Sell around 99 - 100
Stoploss 90 (Closing basis)

PPLPlan1
Buy1 around 119 - 121 | Sell around 125 - 127
Buy2 around 110 - 111 | Sell around 115 - 117
Stoploss 106 (closing basis)
Plan2
Buy Above 132
Sell around 136 - 138
Stoploss 126 (closing basis)

PPL is BullishPPL is currently in a trending phase as per Dow theory and printing higher highs followed by higher lows. The bullish rally is expected to continue, suggested entry price is based on the pull back to 0.382 fib retracement level of the recent swing high. Targets are mentioned on the chart.

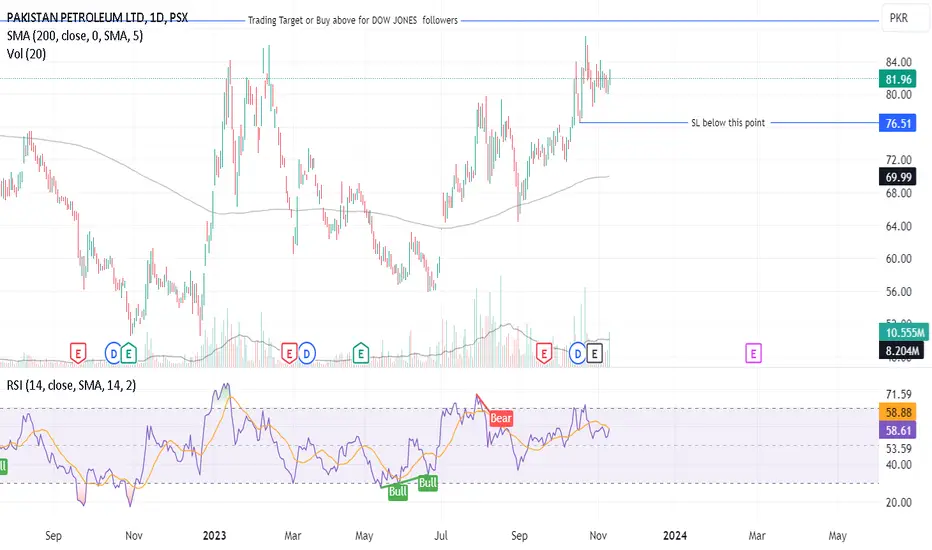
PPL BIG BOY READY FOR ANOTHER LEAP FORWARD PPL is a prominent Pakistani company engaged in Oil and Gas sector.
Last year in similar days it hit the lowest low from there it has been gaining the momentum and price hike. A few days back it hit the high of 87 afterwards it came down to the region of 80s, all these movements has formed the flag which is the continuation pattern so we expect the price to go further up.
The current trend line which has been limiting the price movement upward has been crossed once. We expect next time it shall be crossed successfully. If it happens the targets has been marked on the chart.
Blue line target is for our short term traders
The other targets are for swing traders.
PPL:PSX is in the potential reversal zonePPL:PSX was in uptrend as it was printing HHs and HLs. However, on 1D RSI it has been observed to make a bearish divergence along with a Bearish ABCD pattern on price chart. Volume chart also shows divergence with respect to price chart. Present price is falling within the Potential Reversal Zone (PRZ). A short Entry has been set at downward break of point B, with appropriate SL and Tp1 and Tp2.

PPL can be bearish?PPL currently testing 200 EMA in hourly time frame and closes above at 72.90. If breaks 71.50 it can test 69 level. Which acts as support. However, 74.50 acts as resistance level.

PPLPPL is currently testing its resistance at 74.50 and is poised to potentially breach it, targeting the second resistance level at 77.34. Traders may consider placing a stop loss near the support level of 71, with a secondary support level at 69.

PPL:PSX to resume uptrendOnly Daily timeframe, formation of Bullish Harami at 38.2% Fib shows end of corrective move and resumption of uptrend of PPL. A Bullish Flag (Continuation Pattern) has also been formed highlighting confluence indicating an uptrend.
Trade plan including Entry, SL, TP1 and TP2 have been marked on chart.
