SAZEW (PSX) – Weekly Time Frame Technical AnalysisThe chart represents a Fibonacci retracement-based setup for a potential bullish continuation, provided key levels are respected.
Current Price: PKR 1,094.77
The price is hovering between the critical Fibonacci levels of 0.618 (PKR 1,178.21) and 0.786 (PKR 1,138.38).
If the stock closes two consecutive weekly candles above these Fib levels, the bullish bias will remain intact, signaling a continuation of the upward trend.
Trade Setup:
Buy Stop: Above PKR 1,178.21
Stop Loss: PKR 919.47 (below key support and Fib retracement zone)
Take Profit (TP): PKR 1,429.87, aligned with the 0-level from the previous swing high
RSI Indicator (14):
RSI is at 46.61, showing a neutral-to-weak bias with recent bearish divergence signals.
However, a break above resistance with volume may invalidate the bearish pressure.
Summary:
The chart suggests a conditional long setup. Traders should wait for confirmation through two weekly bullish closes above the 0.618–0.786 retracement zone. If confirmed, the path toward the 1,430 PKR target remains technically feasible, with a clearly defined stop loss to manage risk.
SAZEW trade ideas

Sazew key levelsKey levels are
1404
1271
1198
1056
1002
931
Note: This is not a buy/sell trade call.

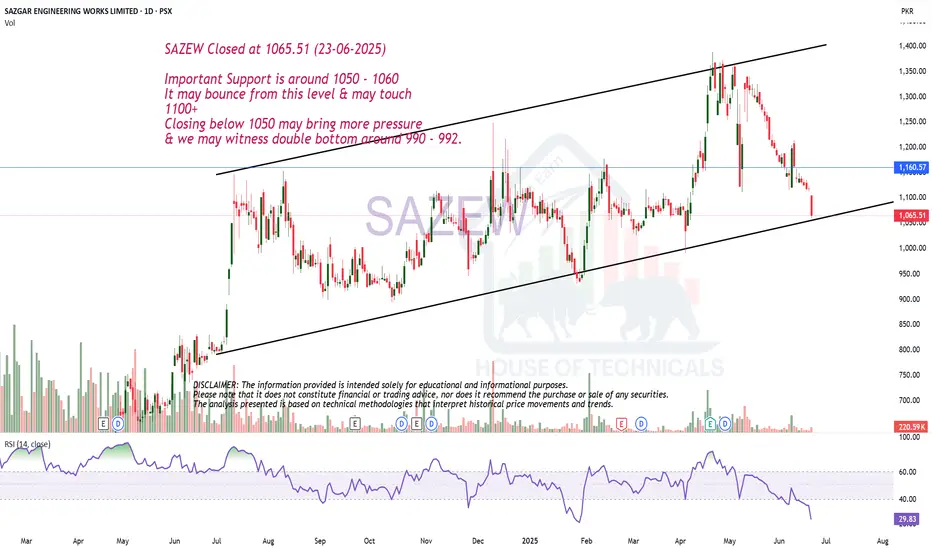
Channel Support SAZEW Closed at 1065.51 (23-06-2025)
Important Support is around 1050 - 1060
It may bounce from this level & may touch
1100+
Closing below 1050 may bring more pressure
& we may witness double bottom around 990 - 992.
Sazgar - Waiting for BudgetSazgar produced excillent performance in both 3rd quarter and 9MFY2025 with PAT of 104% and 186% YoY, respectively.
Technically its looks down at 1144 - 1150 support level.
Budget is the main obstacle.
The government is planning to increase the age limit for importing used vehicles from 3 years to 5 years. If implemented, this could negatively impact volumes of local automobile anufacturers.
The FBR has proposed an increase in withholding tax (WHT) on vehicles with engine capacities above 1,300cc. This would be negative for the local players.
Fundamentally, the light vehicles' manufacturers may face difficulties after budget, being the above, materalized.
Sazgar is excillent company but those external factors are not permitting the buy call.
I am still bullish and will buy more purely on technical basis to recover my losses.

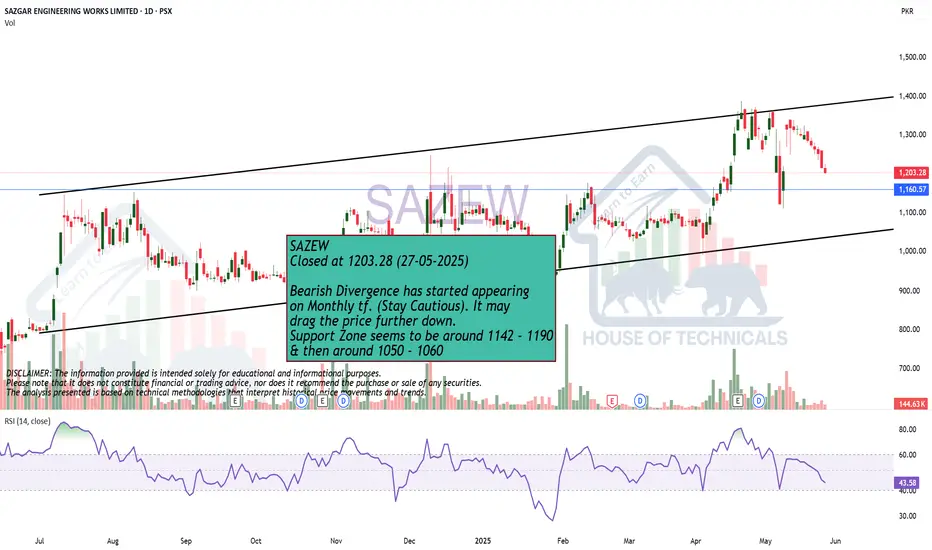
Bearish Divergence has started appearing on Monthly tf.SAZEW
Closed at 1203.28 (27-05-2025)
Bearish Divergence has started appearing
on Monthly tf. (Stay Cautious). It may
drag the price further down.
Support Zone seems to be around 1142 - 1190
& then around 1050 - 1060

SAZEW QUICK SHORT TRADESAZEW has made famous THREE LITTLE INDIANS OR THREE SYMMETRICAL PEAKS PATTERN which shows immediate bearish behavior
SHORT SAZEW 1320-1340
TP1 1260
TP2 1205
SL 1361

Sazew is near to bearish zoneSazew is near breakdown level of 1297.87 (bearish zone). It is expected to drop to 1168.17. Stop loss is 1355
Note: This is not a buy/sell call, It is an analysis.

SAZEW LONG TRADESAZEW is in re-accumulation phase which is evident from its VOLUME WAVES. It is expected to test and exceed recent highs.
BUY SAZEW 1130-1210
TP1 1360
TP2 1400
TP3 1500
SL 1060

Make it or Break it Situation.
Make it or Break it Situation.
Either it will reverse from the current
leve or it may touch 1235 - 1240.

Watchout LevelCrossing & Sustaining 1405 will
lead it towards new high 1500+
Good support levels are 1300 - 1310
and then around 1250

SAZEW | Bullish Flag PatternBack with SAZEW trading idea once again!!!
SAZEW printed a bullish flag pattern with no sign of divergence. A bullish trend continuation is expected, entry is suggested at 1,070 with the stop loss below previous lower high level at 780. Previous top of 1,202 considered as TP1 and after the break out it can leads towards the completion of the pattern, the price can projected towards 1,500 and then 1,700.

SAZEW SAZGAR PSXSazew has breakout after today strong financial result for Q32025 which is more than 100% and dividend is announced too, due to which it shows great potential for next targets.

Bearish Divergence has started appearing
Bearish Divergence has started appearing
on Bigger Tf.
Channel Top is also there.
Stay Cautious.
Sudden Spike can be witnessed till 1450 - 1500
but that would be a Risky Trade to take.
So Better to wait till the Bearish Divergence
plays & bring the price down & settle (may be)
around 1000 - 1050

SazewWith rising rsi, increased expectations of good profits and clean break out from consolidation, sazew looks good for medium to long term

SAZEW Share StrategySazew Buying Strategy:
Key Levels:
1. Breakout level: 1232
2. Stop loss: 1150
3. Targets:
1. 1335
2. 1430
3. 1485
Strategy:
1. Buy after breakout: Enter the trade after Sazew closes above 1232.
2. Risk management: Set a stop loss at 1150.
3. Profit targets: Aim for 1335, 1430, and 1485.
Considerations:
1. Trailing stop loss: Consider using a trailing stop loss to lock in profits.
2. Sustaining above targets: If the price sustains above the final target, consider holding for further gains.
This strategy is based on the provided information. Always conduct your own research and consider consulting a financial advisor before making investment decisions.

SAZEW Weekly ChartBull Flag BO at 1040, Pole Length price change 990.13 in 175 days was added to BO 1040 Result in 100% Target rate 2063 that hypothetically achieved on 28 July 2025 where as 50% Target 1568.87 have to be achieved hypothetically on 05 May 2025
This is not a Trade call. This is just for educational purpose only.

SAZEW Bull Flag Pattern Target Idea.SAZEW Uptrend starts on 28 Jan 2025 and in 14 working days go maximum. Then start downword and move up and down in a range that range BO at 1087 rate and current rate is 1141.
Flage Pole price change is 244 which was added to BO price giving target of 1320 (100%), Half of Target at 50% would be 1207 that expected to be achieved on 16 April 2025, where Final Target have to be achieved hypothetically around 21 April 2025
This is Daily Chart working and everyone have to do his own working for trade of buy or sell.
This is not for trade purpose but only for educational purpose

SAZGAR ENGINEERING WORKS LIMITED (4H, PSX):Sharp bullish move followed by downward sloping consolidation is showing a classic bullish flag on SAZGAR ENGINEERING WORKS.
according to the RSI value which is still lower than 50 percent, the traders and investors should wait for the breakout above 1119.24.
RSI = 43.56: Indicates weak momentum; not yet bullish. as the momentum and volumes are still low.

Make it or Break it Situation.
Currently Near Channel Bottom around
935 - 940.
Either it should bounce from 932 - 935 or
otherwise breaking 930 would open ways
towards 827 - 830.
As mentioned many times in my earlier analysis
that the Bullish Momentum would resume only
if it Crosses & Sustains 1200 - 1250 atleast.

2025 for Sazgar (My Own Sentiment)2025 may be a Cyclical year for stock selection. Fundamentals are very strong.
as an investor the buying should be as soon as now. Then stick to the technicals and buy more at February End or if the price goes down around 905 .
another buy position will be between 660 - 513 .
It can reach till 1700 - 2000 level at the end of year 2025 ( subject to controlled interest rates ).

Still Playing a RangeStill Playing a Range (as shared earlier on 10-12-2024).
Now, Hidden Bullish Divergence on Shorter TF.
Crossing 1116 - 1117 may lead it towards 1150
and then around 1190 - 1200.
On the flip side, 1050 - 1060 may act as a
Good Support & a bounce is expected.
Otherwise, if this level is Broken, we may witness
further Selling Pressure & price may touch 1000 - 10005
Fresh Entry is Recommended only if the
Channel is Broken Upside.

Still have Potential ...?Today it Capped & later it Lower Locked.
Picture will be more clear upon Weekly
Closing.
