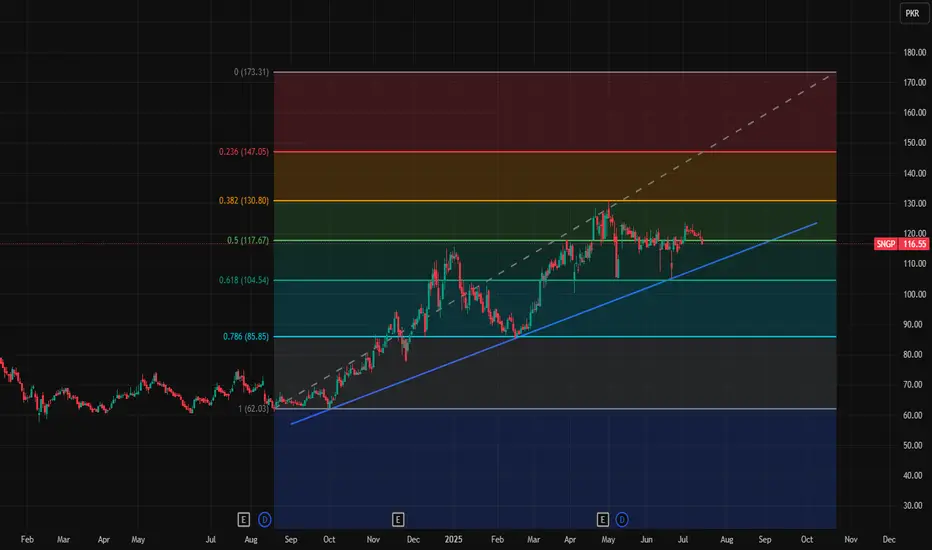
SNGP in long runThis is SNGP daily chart and blue trend line shows its positive movement and it is maintaining sustainable growth.
These are key levels 117.67, 130.8, 147.05 and 173.31
Note: This is not a buy/sell trade call, it is an analysis.
SNGP trade ideas
Bearish Divergence played wellSNGP Analysis
Closed at 117.34 (29-05-2025)
Bearish Divergence played well & dragged the
price from 129 -130 towards 113.
Now, Seems like HL has been printed around 113 - 114.
If this level is broken, we may witness further downside
towards 102 - 107
Immediate Resistance is around 123 - 125 & then
around 130 - 132

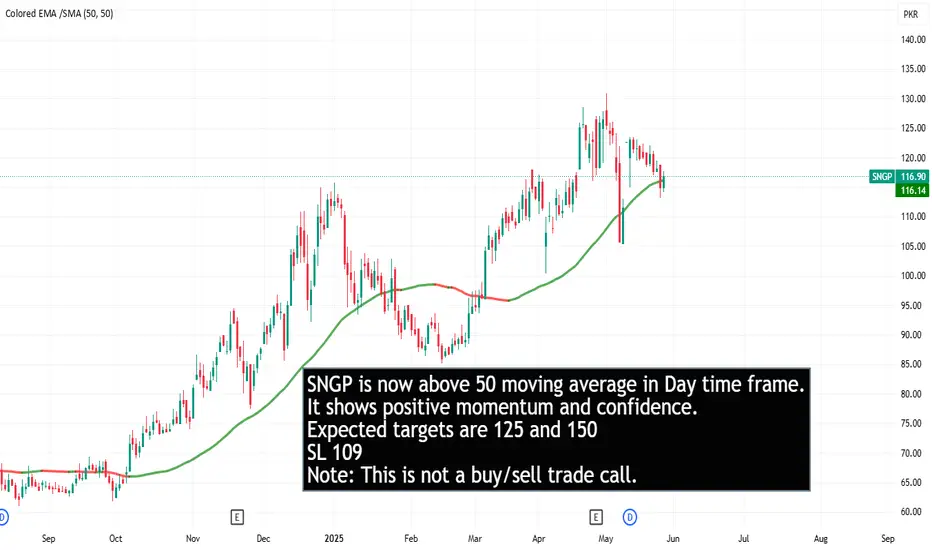
SNGP is ready to fly. SNGP is now above 50 moving average in Day time frame. It shows positive momentum and confidence. Expected targets are 125 and 150
SL 109
Note: This is not a buy/sell trade call.

SNGP buying StrategyBuy Recommendation:
- Current Price: Rs. 124.94
- Suggested Buy Range: Rs. 123-118 (on dip)
- Stop Loss: Rs. 116
- Target Price: Rs. 135

SNGP IS ON THE RISESNGP is rising despite of the fact that market is in pressure, price has taken a good correction and now showing bullish signs, buying is a good option at current price.

Bearish Divergence appeared.Bearish divergence appeared on Daily as well as
Weekly TF.
Strong resistance is there around 127 - 129.
Once this level is Crossed, we have open ways
towards 145 - 147
On the flip side, we have a good support around
120-122. However, breaking 116 this time will bring
more selling pressure towards 113 initially.

After Making HH, now towards HL.
After Making HH, now towards HL.
Bearish Divergence is there, so dragging
the price down.
115 - 118 can be a Good Support level.
Couple of Green candles may confirm HL
at this area.
However, if 110 is broken, we may
witness further Selling pressure.

SNGP | GRAVESTONE DOJIThe daily chart of SNGP shows a strong bullish trend that recently pushed the stock to new highs, but a potential reversal signal has emerged. A Gravestone Doji has formed near the top, a bearish candlestick pattern that suggests buyer exhaustion and possible trend reversal. This is particularly significant as it occurs after a strong upward rally and near a resistance level. Volume remains notable, signaling high market activity around this level. If the price begins to decline, the key support zone between 115.50 and 118 could act as a cushion for a potential bounce. A break below the support zone may confirm a corrective move.

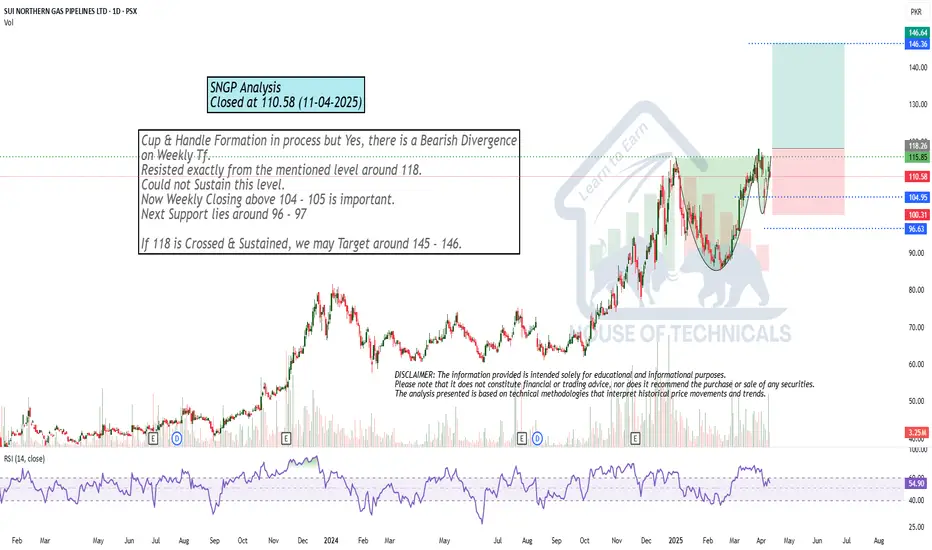
Cup & Handle Formation in process but Cup & Handle Formation in process but Yes, there is a Bearish Divergence
on Weekly Tf.
Resisted exactly from the mentioned level around 118.
Could not Sustain this level.
Now Weekly Closing above 104 - 105 is important.
Next Support lies around 96 - 97
If 118 is Crossed & Sustained, we may Target around 145 - 146.
Cup & Handle Formation in process but..Cup & Handle Formation in process but Yes, there is a Bearish Divergence
on Weekly Tf.
Resisted exactly from the mentioned level around 116-117.
Could not Sustain this level.
Now Weekly Closing above 104 - 105 is important.
Next Support lies around 96 - 97
If 118 is Crossed & Sustained, we may Target around 145 - 146.

SNGP due for another rally on 1DSNGP is in uptrend and is printing HHs and HLs on 1D timeframe. Recently, between Jan & Mar 25, it has formed a cup and handle pattern indicating another rally upon breaking of resistance area 113.09-115.34. There being no negative indication on RSI, I would put my Buy Stop on break above 115.34. The potential target is 145.08. SL is placed under the handle at 108.01.
Recommended booking of TPs is:
TP1=122.67
TP2=130
TP3=137.33
TP4=145.08
Good luck.

Bearish Divergence has started appearing but...Bearish Divergence has started appearing
on Weekly TF but not yet on Monthly, so
a pressure might be seen around 116 - 117.
& Sustaining this level will expose 135 - 138 targets.
On the flip side, 101 - 109 may act as a Good
Support zone in case of pressure.

SNGPSNGP Analysis
In Montly time frame it must give closing above 95
No any Negative sign in weekly and Daily time frame

Monthly + Weekly View
If Monthly Candle closes above 95, it would
confirm a Morning Star Formation which is a
Positive Sign.

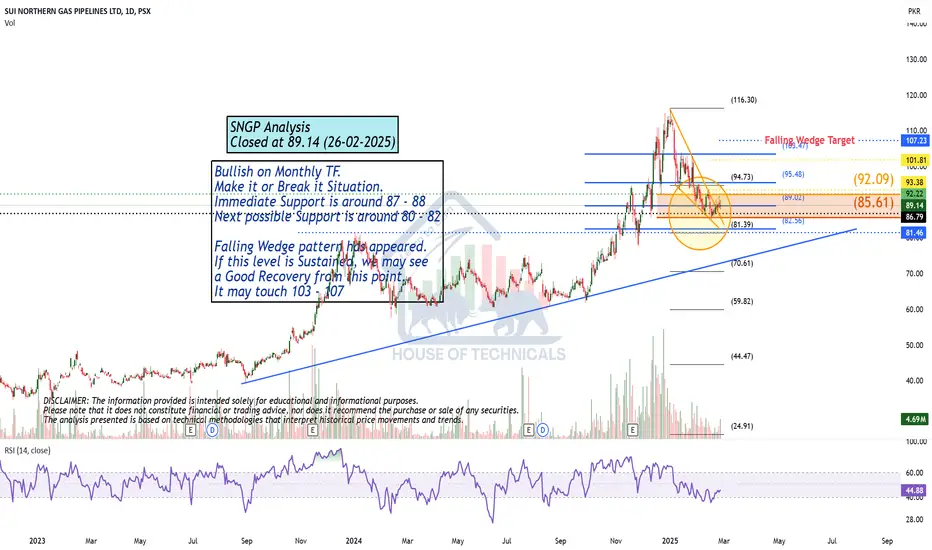
Bullish on Monthly TF.Bullish on Monthly TF.
Make it or Break it Situation.
Immediate Support is around 87 - 88
Next possible Support is around 80 - 82
Falling Wedge pattern has appeared.
If this level is Sustained, we may see
a Good Recovery from this point.
It may touch 103 - 107

SNGP - LongIt is a slow item, but due to IMF pressure prices of GAs will increase for industry and residential customers which will benefit SNGP. Also, their line losses have reduced singificantly that will improve thier profitability.
I am eyeing a long-term target of Rs 165
Short/medium-term targets are Rs 104, 115 and 124
SL and retesting area 91.5 to 92

Technically Buy Fundamentally No TouchFundamentally, PSX:SNGP has a serious issue due to its valuation i.e Decreasing Free Cash Flow and ROE.
Therefore I am not taking a long term position
Technically: I am still interested in it. A Bullish reversal @84 area can lead to Buy position till 137. We need this confirmation on both Daily and Weekly timeframe.

Still Bullish on Bigger TF.Still Bullish on Bigger TF.
But the Bearish Divergence is
not letting it move upside. However, it is
currently near its Trendline Support. It
should bounce from 95 - 96.
& If 91 - 92 is broken, we may witness 85 - 86.
On the flip side, Crossing above 104 - 105 may
lead it towards 114 - 115 initially.

Fundamentally very strong. While technicals to confirm positionThe support zone had been drawn on Daily FM.
It was in the channel for as long as 180 days.
The channel was broken in October 28 providing with the 52% return.
The weekly support at 79 is already confirmed by 61% Fibbonacci from its current uptrend.
A close and candle pattern above this level will boost the price further to 136.
Traders Please avoid the above. As these analysis for one year.

a Very Important Level to Sustain.a Very Important Level
to Sustain.
Inverse H & S on 15mins TF.
Immediate Resistance around
103.50 - 105.20; Crossing & Sustaining
it will lead the price towards 115 - 116.

Make it or Break it..Selling Pressure was observed in last
couple of trading days.
But still it did not break its HL yet & is Still
Bullish on Bigger Time Frames.
Currently it tested its Trendline Support;
so this can be a Make-it or Break-it Level.
It has the Potential to touch 124 - 125 once
it Crosses & Sustains 116.
