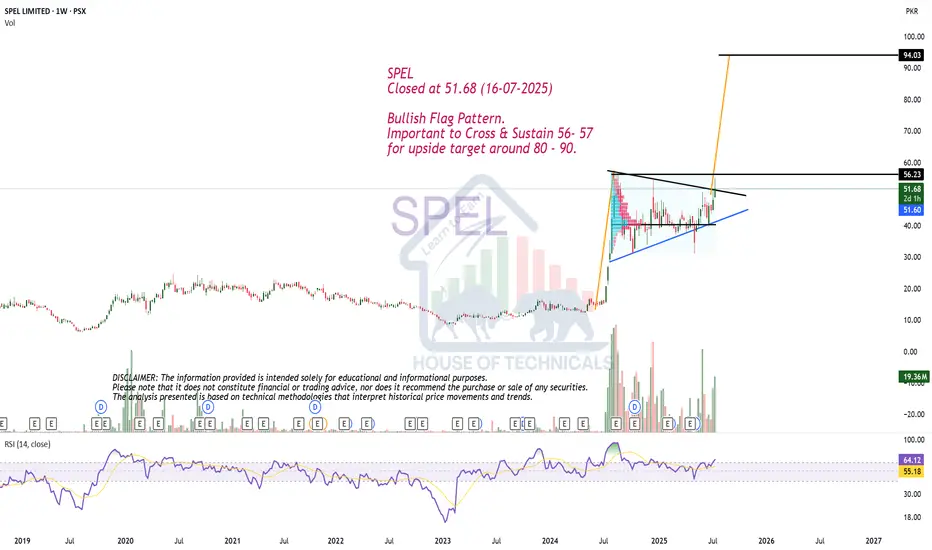
Bullish Flag Pattern.SPEL
Closed at 51.68 (16-07-2025)
Bullish Flag Pattern.
Important to Cross & Sustain 56- 57
for upside target around 80 - 90.
SPEL trade ideas
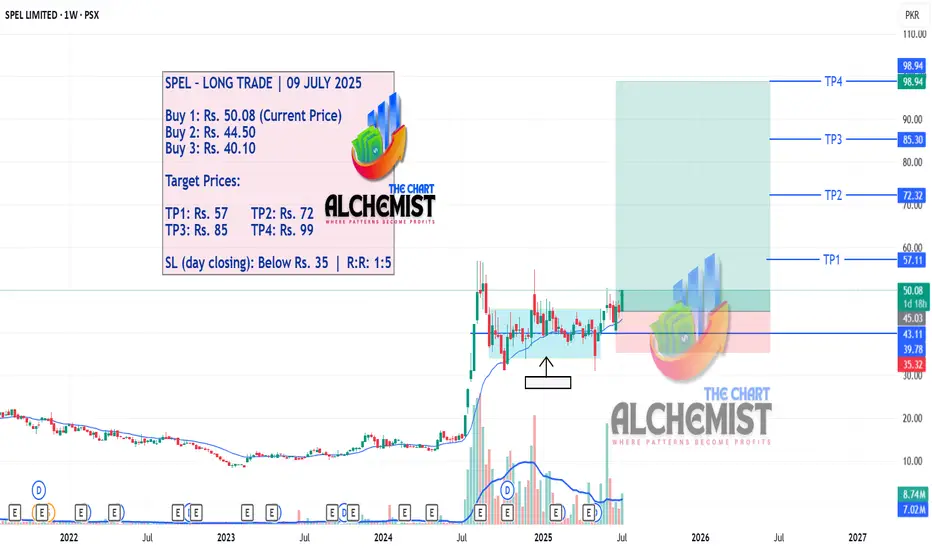
SPEL – LONG TRADE (THIRD STRIKE) | 09 JULY 2025SPEL – LONG TRADE (THIRD STRIKE) | 09 JULY 2025
SPEL is setting up for a third strike entry. On the 1-week timeframe, it has formed a Double Bottom Bull Flag, signaling potential for another strong leg upward. The price action is winding around an excess line with several bullish structures already in place—indicating high probability for larger targets.
SPEL LONG TRADE (SECOND STRIKE)SPEL LONG TRADE (SECOND STRIKE)
SPEL went into uptrend with a Spike in July 2024. Making a high of 56, it pulled back in Wyckoff Re-Accumulation for months. Now it is in upward reversal as indicated by Volume Distribution. Price is trading above EMA-20. It showed a healthy pull back and now resuming its uptrend journey. During this progression, it has made an Axial Line on Day TF, which is a low-risk spot to enter the trade.
🚨 TECHNICAL BUY CALL – SPEL🚨
BUY1: 45.14
BUY2: 43.5
BUY3: 42.6
📈 TP : Rs. 51.86
📈 TP : Rs. 57.27
🛑 STOP LOSS: BELOW Rs. 39 (Daily Close)
📊 RISK-REWARD: 1:2.9
Caution: Please buy in 3 parts in buying range. Close at least 50% position size at TP1 and then trail SL to avoid losing incurred profits in case of unforeseen market conditions.
PLEASE BOOST AND SHARE THE IDEA IF YOU FIND IT HELPFUL.


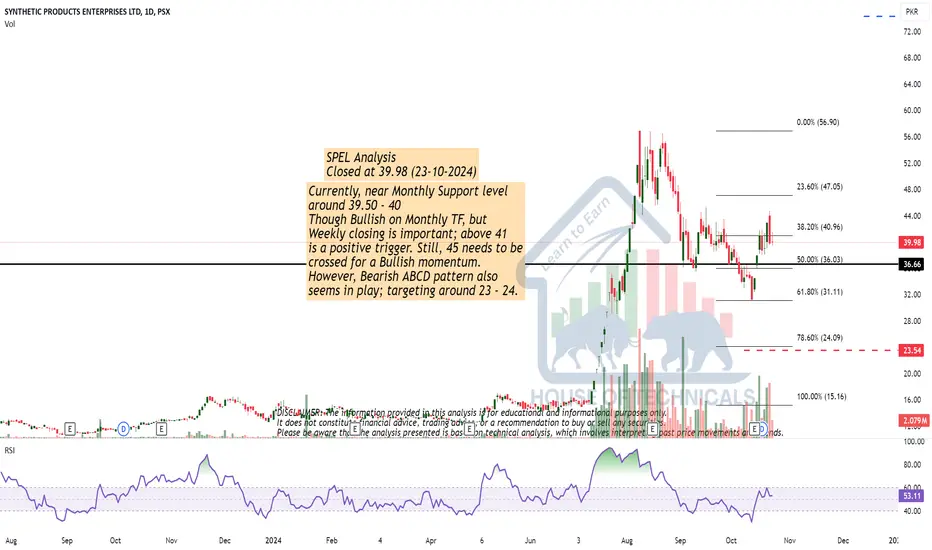
No Bearish Divergence yet on Bigger TF, but..No Bearish Divergence yet on Bigger TF.
Strong Support around 36 - 37 which is
being respected.
Immediate Support seems to be around
38.30 - 38.50
Immediate Resistance is around 45 - 46
& then around 56 - 57.
Crossing & Sustaining 57 may lead it towards
New Highs.


SPEL offers 78% upside from these levels50% of the planned quantity should be entered at Rs. 45.26 with SL of 31. Remaining 50% quantity can be added once pole is breakout @ 80.72 which is a 78% capital upside.
The stock has retraced to 0.618 level @ 31 which is the HL, now the stock is ready to define its HH that potentially be the flag pole projection being out ultimate Target


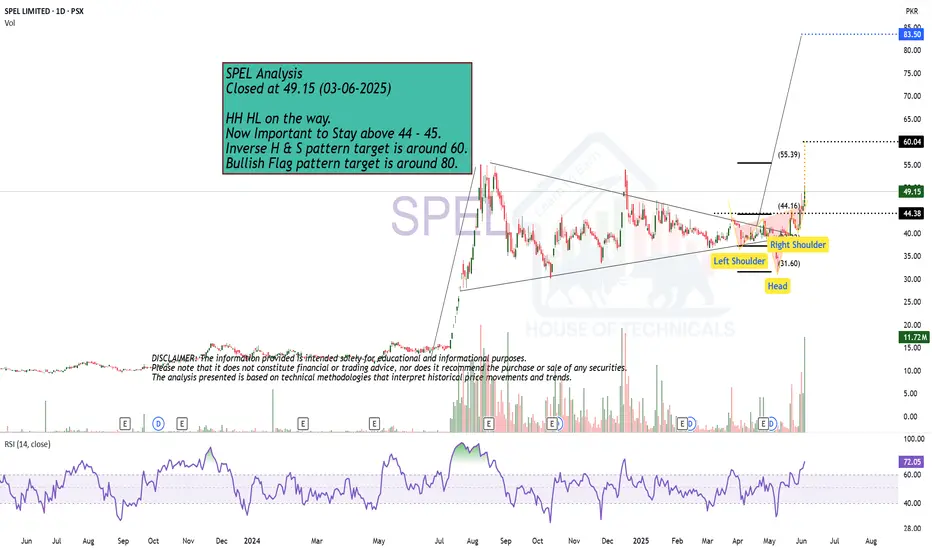
SPEL -PSX Technical Analysis
Price after breaking the bearish parallel channel went sideways. Now it can go either way up or down. RSI indicator suggest that it is likely to continue going down.
Therefore, wait till it crosses Rs 42.25 value to initiate Buy.
EMA 89 suggests that it is still in up-trend but price is closing on it and hence may go down.

