SYM another perspectiveAnother perspective of SYM on the basis of Ascending and Descending Channels along with Supports and Resistances marked on chart for instant help.
About SYMMETRY GROUP LTD
Sector
Industry
Website
Headquarters
Karachi
Founded
2012
ISIN
PK0115701010
FIGI
BBG01CCVDM07
Symmetry Group Ltd. operates as an interactive marketing company. It engages in providing digital strategy, consulting, transformation, digital commerce, data science, mobility, and retail and research services. Its operating segments include Transformation, Interactive Marketing, Digital Commerce, and Mobility. The Transformation segment offers data sciences, digital strategy, website, software & application development, IoT devices, and technology & digital consultancy. The Interactive Marketing segment provides marketing of products and services through interactive mediums such as websites, mobile phones, and digital out of home displays. The Digital Commerce segment offers advisory and hands-on support to clients providing advanced digital commerce services for online businesses, marketplaces and general websites. The Mobility segment allows customers to collect essential data through various touchpoints using mobile applications, SMS and voice solutions. Symmetry Group was founded by Sarocsh Ahmed and Adil Ahmed on February 3, 2012 and is headquartered in Karachi, Pakistan.
Related stocks

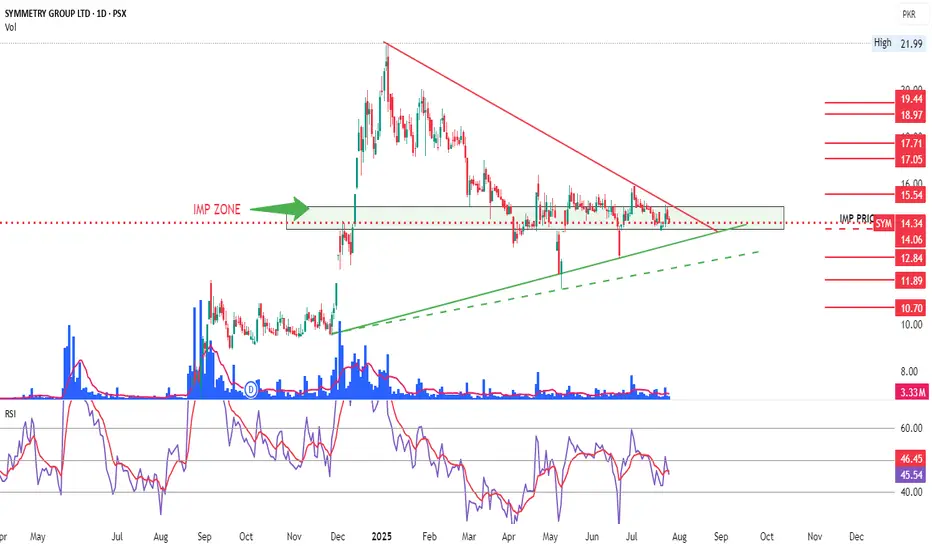
SYM in a sqeez and deciding to go either way Asymmetrical Triangle pattern. Can or may break in the direction of the original trend, which as per chart is on the upside. The marked zone is of significance and needs to be sustained for upward move.
Red marked lines are immediate Supports and Resistances.
SYM – BUY SIGNAL (SECOND STRIKE) | 23 JULY 2025SYM – BUY SIGNAL (SECOND STRIKE) | 23 JULY 2025
The previous signal on SYM remains valid, but the recent price structure has provided a renewed opportunity for a fresh long position. After completing a pullback in May 2025, the stock broke out from the pullback channel and confirmed the breakout wit

Live Buying Signal in SymLive Khareedo (Buy) signal in Sym at 14.9. Lets see how long it will go.
Note: This is not a buy/sell trade call. Trade at your own will. Use stop loss.

Important Fib. Support???11.50 - 13.84 is an Important Support Zone.
Wait for the Couple of Bullish Candles in this
Zone for Fresh Entry.

SYM. .... Resumption of Uptrend ??Observe price between 12.50 and 11.88
Once price gets a regection on daily TF with a pin bar and High Volume , Buy trades with Target upto 20,30 and 42 are expected.

SYMMETRY GROUP LTD LONG IDEAGolden Cross Strategy (50, 200 MA)
Two moving averages are plotted: a 50-day (likely the green line) and a 200-day (likely the blue line).
The current price ₨14.19 is below the 50-day moving average (₨16.11) and the 200-day moving average (₨12.24). This suggests the stock is trading in a weak zone

SYM Technical Analysis: Potential Bullish SetupSYM (Symmetry Group Ltd) is currently in an overall bullish trend and holding above a rising trendline. The price is currently at the Fib Golden Zone. The RSI is synced with price action, which supports the bullish outlook. In addition, there's a potential hidden divergence that could signal continu

ABCD Pattern appearingImportant fib level tested.
ABCD pattern appearing but not
yet confirmed.
Should not break 15 on Closing basis.

SYM - PSX - 4h - Sideways TradingSYM on 4h trading sideways range. Price is currently at a buyable range.
A parallel channel has been drawn, where price will remain in the range.
Trade Value
Buying Zone: 17.80 ~ 17.30
TP Range: 18.80 ~ 19.30
SL: 16.90

See all ideas
Summarizing what the indicators are suggesting.
Oscillators
Neutral
SellBuy
Strong sellStrong buy
Strong sellSellNeutralBuyStrong buy
Oscillators
Neutral
SellBuy
Strong sellStrong buy
Strong sellSellNeutralBuyStrong buy
Summary
Neutral
SellBuy
Strong sellStrong buy
Strong sellSellNeutralBuyStrong buy
Summary
Neutral
SellBuy
Strong sellStrong buy
Strong sellSellNeutralBuyStrong buy
Summary
Neutral
SellBuy
Strong sellStrong buy
Strong sellSellNeutralBuyStrong buy
Moving Averages
Neutral
SellBuy
Strong sellStrong buy
Strong sellSellNeutralBuyStrong buy
Moving Averages
Neutral
SellBuy
Strong sellStrong buy
Strong sellSellNeutralBuyStrong buy
Displays a symbol's price movements over previous years to identify recurring trends.
Frequently Asked Questions
The current price of SYM is 14.28 PKR — it has decreased by −0.42% in the past 24 hours. Watch SYMMETRY GROUP LTD stock price performance more closely on the chart.
Depending on the exchange, the stock ticker may vary. For instance, on PSX exchange SYMMETRY GROUP LTD stocks are traded under the ticker SYM.
SYM stock has fallen by −1.45% compared to the previous week, the month change is a −10.19% fall, over the last year SYMMETRY GROUP LTD has showed a 201.90% increase.
SYM stock is 2.62% volatile and has beta coefficient of 1.52. Track SYMMETRY GROUP LTD stock price on the chart and check out the list of the most volatile stocks — is SYMMETRY GROUP LTD there?
Yes, you can track SYMMETRY GROUP LTD financials in yearly and quarterly reports right on TradingView.
Like other stocks, SYM shares are traded on stock exchanges, e.g. Nasdaq, Nyse, Euronext, and the easiest way to buy them is through an online stock broker. To do this, you need to open an account and follow a broker's procedures, then start trading. You can trade SYMMETRY GROUP LTD stock right from TradingView charts — choose your broker and connect to your account.
Investing in stocks requires a comprehensive research: you should carefully study all the available data, e.g. company's financials, related news, and its technical analysis. So SYMMETRY GROUP LTD technincal analysis shows the sell today, and its 1 week rating is sell. Since market conditions are prone to changes, it's worth looking a bit further into the future — according to the 1 month rating SYMMETRY GROUP LTD stock shows the buy signal. See more of SYMMETRY GROUP LTD technicals for a more comprehensive analysis.
If you're still not sure, try looking for inspiration in our curated watchlists.
If you're still not sure, try looking for inspiration in our curated watchlists.