SYM another perspectiveAnother perspective of SYM on the basis of Ascending and Descending Channels along with Supports and Resistances marked on chart for instant help.
SYM trade ideas

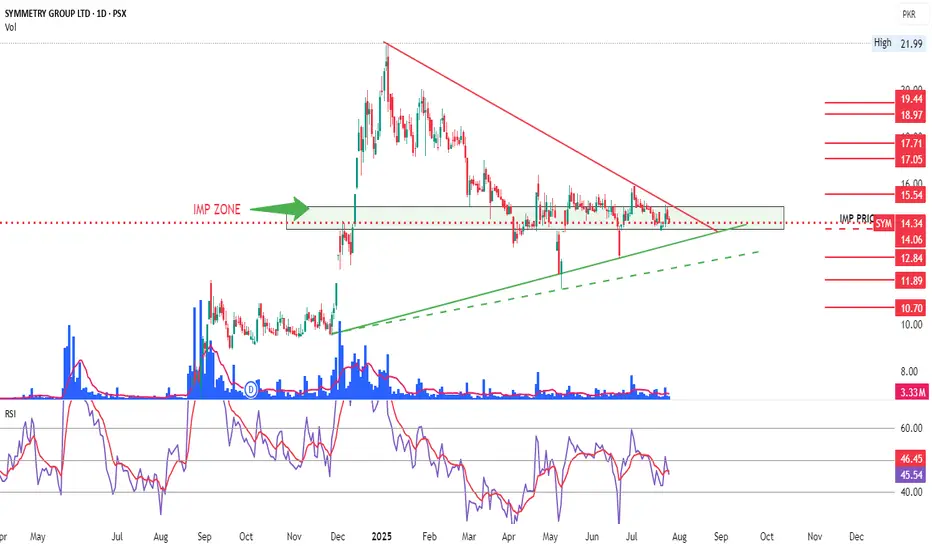
SYM in a sqeez and deciding to go either way Asymmetrical Triangle pattern. Can or may break in the direction of the original trend, which as per chart is on the upside. The marked zone is of significance and needs to be sustained for upward move.
Red marked lines are immediate Supports and Resistances.
SYM – BUY SIGNAL (SECOND STRIKE) | 23 JULY 2025SYM – BUY SIGNAL (SECOND STRIKE) | 23 JULY 2025
The previous signal on SYM remains valid, but the recent price structure has provided a renewed opportunity for a fresh long position. After completing a pullback in May 2025, the stock broke out from the pullback channel and confirmed the breakout with a retest around Rs. 12.8. With this structure reset, the ongoing reversal offers a compelling new entry for bullish continuation.

Live Buying Signal in SymLive Khareedo (Buy) signal in Sym at 14.9. Lets see how long it will go.
Note: This is not a buy/sell trade call. Trade at your own will. Use stop loss.

Important Fib. Support???11.50 - 13.84 is an Important Support Zone.
Wait for the Couple of Bullish Candles in this
Zone for Fresh Entry.

SYM. .... Resumption of Uptrend ??Observe price between 12.50 and 11.88
Once price gets a regection on daily TF with a pin bar and High Volume , Buy trades with Target upto 20,30 and 42 are expected.

SYMMETRY GROUP LTD LONG IDEAGolden Cross Strategy (50, 200 MA)
Two moving averages are plotted: a 50-day (likely the green line) and a 200-day (likely the blue line).
The current price ₨14.19 is below the 50-day moving average (₨16.11) and the 200-day moving average (₨12.24). This suggests the stock is trading in a weak zone relative to its medium-term trend.
Support & Resistance
Price recently broke below a key upward trendline, shown as a blue diagonal line sloping upwards.
The stock seems to be testing this broken trendline as resistance.
Trade Markers
Several "Target" labels (green and red) appear on the chart, showing past trading signals.
Green icons indicate successful bullish targets; red icons indicate bearish signals or failure to sustain levels.
RSI (Relative Strength Index)
RSI is shown at 40.23, slightly below the neutral 50 level.
There’s also a yellow moving average line for RSI, currently at 36.19.
The RSI has been in a bearish phase since early 2025, with occasional “Bear” and “Bull” signals marked on the indicator. Recently, the RSI made a small uptick, but still stays below the 50 mark, which hints at weak buying strength.
⚡ Insights
Trend Weakness: The price has broken below a long-standing ascending trendline and is struggling to regain that line as support, which is a bearish technical signal.
Bearish Momentum: The RSI is under 50, showing weak bullish momentum and limited buying interest.
Resistance Overhead: The 50-day moving average around ₨16.11 and the downward-sloping trendline are likely to act as resistance in the near term.
Possible Bottom Formation: If the RSI holds above 36 and starts climbing, combined with price stabilizing around ₨14.19-₨12.50, a short-term reversal could happen — but confirmation is needed.
✅ Actionable Takeaways
For Traders: Avoid long positions until the stock breaks above ₨16.11 (50 MA) or shows a clear bullish RSI crossover.
For Investors: If you’re looking for value, watch for a base formation near the ₨12.24 (200 MA) region.
For Short Sellers: As long as the price remains below the 50-day MA and the RSI doesn't cross 50, bearish setups remain favorable.

SYM Technical Analysis: Potential Bullish SetupSYM (Symmetry Group Ltd) is currently in an overall bullish trend and holding above a rising trendline. The price is currently at the Fib Golden Zone. The RSI is synced with price action, which supports the bullish outlook. In addition, there's a potential hidden divergence that could signal continued upward momentum. A possible gap fill towards 11.88 might also present a good buying opportunity.
Trading Recommendations:
Buy 1 (CMP): 15.05
Buy 2: 14
Stop-Loss: Closing below 9
Take Profit 1: 21
Take Profit 2: 26
Take Profit 3: Open
Happy trading!

ABCD Pattern appearingImportant fib level tested.
ABCD pattern appearing but not
yet confirmed.
Should not break 15 on Closing basis.

SYM - PSX - 4h - Sideways TradingSYM on 4h trading sideways range. Price is currently at a buyable range.
A parallel channel has been drawn, where price will remain in the range.
Trade Value
Buying Zone: 17.80 ~ 17.30
TP Range: 18.80 ~ 19.30
SL: 16.90

UptrendBeautifully making HH HL.
Sustaining 20.15 will lead it towards 24 - 25.
However, it should not break 17 for now.

SYM - PSX - Technical AnalysisSYM is in bull run.
At present KVO is suggesting a strong bull run; however, a bearish divergence has formed on RSI, which may cause the prices to retrace a bit which is good as then a Higher Low of the Bull cycle will be defined and then price will again go up. Therefore, buy on dip is quite possible but in case price continues to go up then Buy-3 should be executed, otherwise Buy-1 and Buy-2 would suffice.
Trade Value:
Buy-1: 17.17 (at fib 0.38 retracement)
Buy-2: 16.33 (at fib 0.50 retracement)
Buy-3: 20.11 (if Buy 1 and Buy 2 are not triggered)
TP-1: 21.67
TP-2: 23.63
SL: 12.30


SYM is expected to cross 82 level in next 06 to 24 months.SYM consistency showing positive growth and it is expected to cross 20 level soon and then 35, 51, 67 and 82 in next 12 to 24 months
Note: This is not a buy/sell call.
Use stop loss.

SYM ready for the take off !SYM has successfully retraced to the trendline of Pennant. After successfully forming Pennant, the stock has went into healthy consolidation and retraced to the levels and finally about to break the last LH around 10.90, which posed to be a significant resistance level.
Once SYM crosses 10.91, it will be poised to reach 16 soon after giving further confirmation by breaking the Pennant pole @ 11.90 level, potentially offering around ~50% upside on current levels.

SYM ready for another 15% gainReady to touch the final leg of the Bullish Flag i.e. 15% from current levels.
Instant entry can be made with SL around 14.3 for the final TP of 16.7


SYM-LONGSYM is trading in a bullish trend and has formed a flag shaped pattern which is a trend continuation pattern,wo we will take a long entry

SYM | Bullish Pennant PatternThis chart shows a symmetrical pennant formation for Symmetry Group Ltd., indicating a potential breakout. The pattern suggests bullish momentum if the price breaks upward, with key targets set at different levels: the initial target at 10.90 PKR, a double top target at 11.85 PKR, and a pennant target at 14.45 PKR. A stop loss is defined at 8.89 PKR, mitigating downside risk if the breakout fails. This setup suggests traders are anticipating upward movement, with increasing potential as targets are met, though the stop loss limits potential losses in case of a downward move.
