SYS Long term BUY CallAfter consolidation in a channel, sys has broken out and we caught the first 22% move, Due to recent developments, it still shows strong upward momentum.
SYS trade ideas
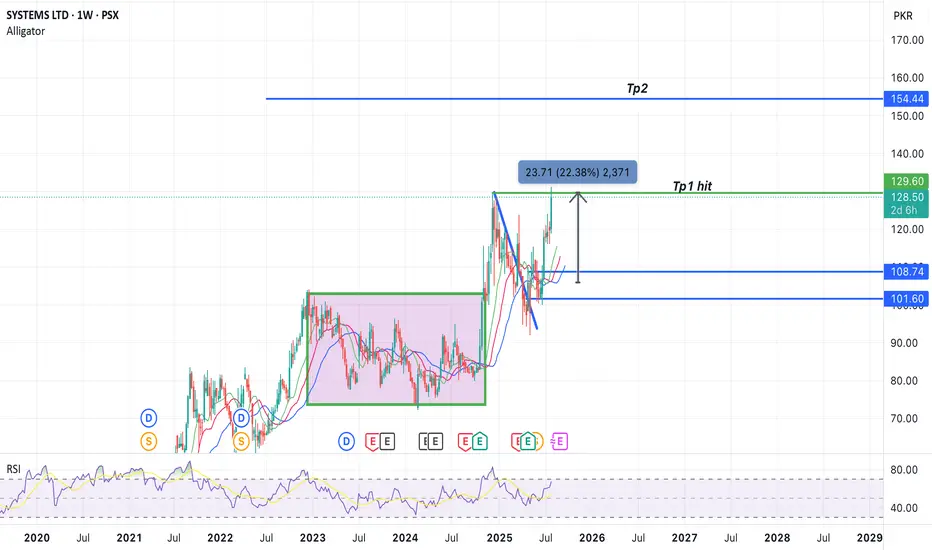
SYS: System limited flag pattern breakoutPrice has broken out form flag pattern. This week closing will mark the further confirmation. Time to build the position

SYS ON DAILY TFSYS is approaching the Top of the Green Ascending channel and may confront Resistance. It started moving up after hitting S2 price level of the Pivot. Point D of the Bearish ABCD Rev TP is approx @ 135-140 Price level, the Top of a Bigger Ascending channel.
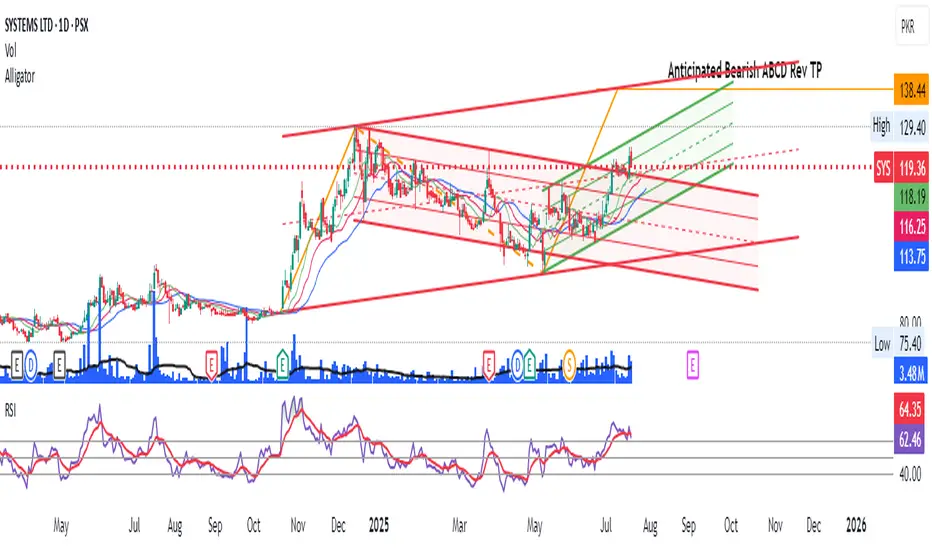
Bid on AI system limited Pakistan top IT services companyABCD pattern
Rsi div
Trend reversal
3 bull point to buy
comment if you have any bearish point.

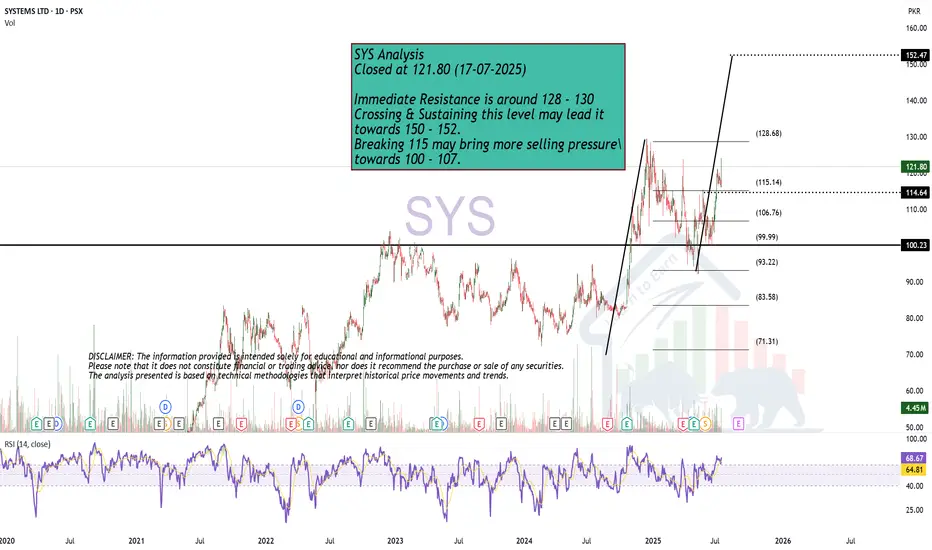
ABCD PatternSYS Analysis
Closed at 121.80 (17-07-2025)
Immediate Resistance is around 128 - 130
Crossing & Sustaining this level may lead it
towards 150 - 152.
Breaking 115 may bring more selling pressure\
towards 100 - 107.
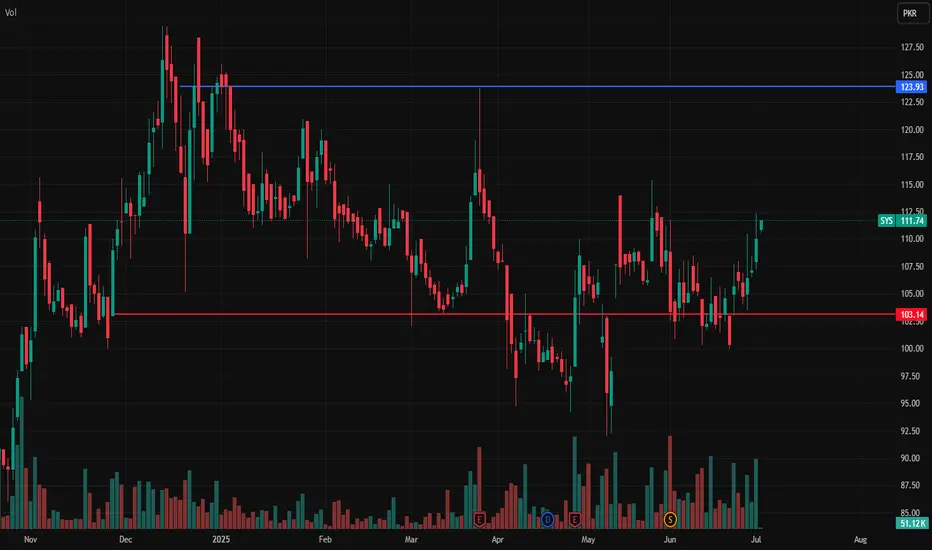
SYS – LONG TRADE (SECOND STRIKE) | 12 JULY 2025SYS – LONG TRADE (SECOND STRIKE) | 12JULY 2025
The stock previously trended downward in a pink channel but consolidated and formed a springboard (light blue channel). After achieving TP1 in our previous call, the stock has created a bullish structure, making this location a good spot for a second entry.

Sys key levelsSys is in bullish trend and buying is possible with blue lines TP and red line SL
Note: This is not a buy/sell trade call.
SYS has completed its retracementSYS has completed its retracement and is taking support from its trendline.
A bullish movement can be observed

100 is a Very Important Support level.SYS Closed at 104.21 (05-06-2025)
100 is a Very Important Support level
that should be sustained on Monthly basis.
Immediate Resistance is around 114 & then
128 - 129. Crossing this level will make it
more Bullish with targets around 150+
But if it breaks 92, there would be more
selling pressure & next Support would be
around 82 - 83 then.

SYS Long position SYS Long position on weekly time frame, long term trade entry with a buy stop on top of last HH

SYS buying Opertunity Buy Recommendation: Accumulate on weakness below 530-515.
Risk Management: Set stop loss at 507.
Target Price Range: 580-617.
This strategy suggests buying SYS stock on dips, managing risk with a stop loss, and aiming for higher targets.

Weekly Closing just at Resistance!Weekly Closing just around Resistance
level (580), so a slight pressure may be seen, unless it
Sustains 580. If this be the case, 545 - 565 can be witnessed.
Bullish on Weekly TF & a perfect
Morning Star Formation on Weekly Tf.
Also, it has retested the previous breakout level
around 520.
Now it should Cross & Sustain 605-606 to continue
its Bullish Momentum & immediate targets can be around
650 - 655.
On the safe side, 596 - 621 Zone is a Resistance zone.

Sys is heading to 600+Sys is in bullish trend and it is technically in strong bullish trend and it is expected to cross 600 and 620 level
Note. This is not a buy sell call and use stop loss too.

Re-Testing of Breakout Level around 520.Re-Testing of Breakout Level around 520.
If Weekly Candle Closes above 520 - 521, we may
expect an Upside towards 550.
Also there is Bullish Divergence so we may
expect that it will play this time & push the price upside.
On the flip side, 500 - 504 is the Channel Bottom.
and Remember, Once 650 is Crossed with Good Volumes,
it may expose New Highs targeting around 700.

SYS-LONGOn the daily chart, bullish divergence has been identified, implying the continuation of the current upward trend. Good fundamental stock also give a good profit in short time.

SYS - PSX - Technical AnalysisOn daily time frame, price after defining a Higher Low of bull cycle is going up. A hidden bullish divergence has also played indicting that trend will continue. KVO also suggest that bull run is still on. TPs have been set using Fib.
Trade Value:
Buy CMP: 599.78
TP1: 679
TP2: 716
SL: 520

Very bullish Pak IT stock I'm very bullish on this Pakistani IT stock - the growth potential is immense for 5-20 years for long term holding
See sales growth & Profit margin and earning ratios - dps.psx.com.pk
Sales are to mostly foreign clients , therefore local currency and economic risk is manageable

Systems Buy Idea!Systems has been accumulating for exactly the same time now as last time
if it breaks above 600-700 could be the final target

SYS | Parallel Channel VS Support LevelThere are two possible scenarios in SYS technical chart, either it follows parallel channel or pull back from its current support level.

SYS, Flag BreakoutBullish Trend
Bullish Flag
Breakout of Flag
1. BUY at Current price
2. BUY at Breakout Retest
Stoploss 396
Target 680

SYS - BearishLarger Trend: Consolidation Phase
Smaller Trend: Bearish (Breaked 4h choch)
Overall Bearish

SYSWe can attempt to buy SYS from specified level if it gives breakout of LH , also bullish divergence occur indicate that it move upward.
SL , TP mention in chart.

Currently Near Resistance around 459 - 465.Currently Near Resistance around 459 - 465.
For Fresh Entry, one should wait for 480 to
Cross & sustain.
On the flip side, 427 - 430 may act as an
Important Support.
